
Figures & data
Figure 1. Phylogenetic relationship of Australian epidemic lineages (ELs). A phylogenetic tree of 385 B. pertussis isolates was constructed using the maximum likelihood method. The branch length was scaled by divergence time as generated by BEAST. The tree was rooted using the B. pertussis reference genome Tohama I as an outgroup. Three major lineages were coloured at the branch. The coloured lines and columns from left to right Prn presence or absence, ptxP allele types, the geographic source of isolates and period of isolation.
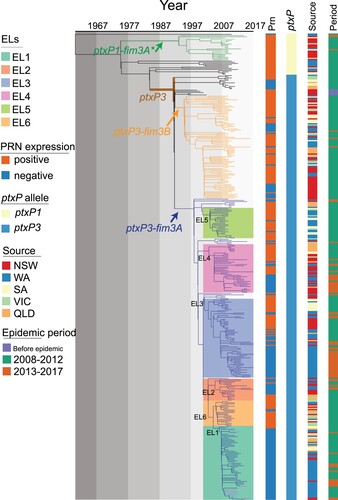
Figure 2. Lineage through time (LTT). LTT plot was based on the temporal distribution of nodes in the Australian B. pertussis phylogenetic tree. A&C: LTT for allelic types and the lineages identified from the phylogenetic tree. Y axis shows the log of the number of ancestral lineages; X axis shows the estimated emerging time of each lineage. Different lineages are coded by line colours. B: Schematic tree of Australian B. pertussis isolates showing phylogenetic relationships of allelic types and ELs.
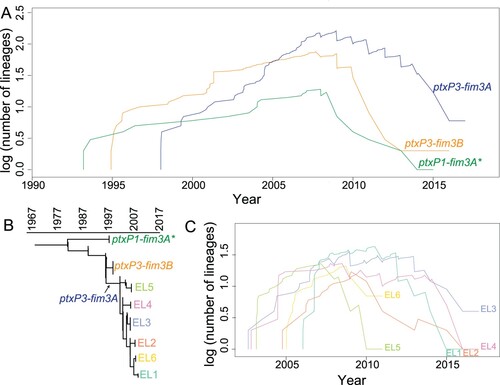
Figure 3. Relative risk analysis of Australian B. pertussis isolates within and between states. A–D: Intrastate WA (Western Australia) relative risk by MRCA within a defined period. Each point represents the risk that a pair of isolates collected from particular cases have an MRCA within a defined evolutionary timeframe relative to the risk that a pair of distal isolates (defined as two isolates from WA separated by > 260 km) have an MRCA in the same evolutionary timeframe. E–H: Interstate relative risk by MRCA within a defined period. Each point represents the risk that a pair of isolates collected from particular cases have an MRCA within a defined evolutionary timeframe relative to the risk that a pair of isolates from different state have a MRCA in the same evolutionary timeframe. One of the pair of isolates was selected from the specific state as shown in X-axis for each column and the other isolate was selected from any other 4 states. Each panel represents a different MRCA interval: (A) MRCA < 1.5 years, (B) MRCA 1.5–3.5 years, (C) MRCA 3.5–8 years, (D) MRCA 8–16 years. Grey broken lines represent the reference relative risks (reference ratio divided by itself, thus always equals one, see methods). Error bars represent the 95% CIs from 100 times bootstrap.
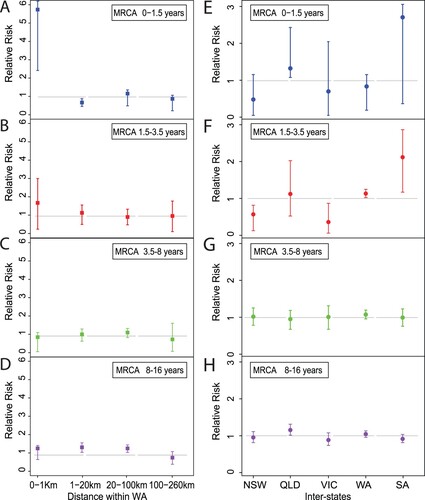
Figure 4. Phylogenetic tree of Australian and global B. pertussis isolates. Phylogenetic tree of 1452 B. pertussis isolates based on genome-wide SNPs. The tree was rooted using a group of ptxP2 isolates related to early Dutch strain B189 (isolated in 1991). The five columns to the right of the tree show the country of isolation, presence or absence of Prn, ptxP-fim3 genotype, bscI allele and Australian lineages per colour legends. The background colours represent the ELs as indicated. For both tree branches and the 5th Column, grey background colour of individual or groups of isolates marks Australian isolates not belonging to any ELs. Bootstrap values from 100 replicates are indicated by the colour of the branches as shown. Black arrows mark three Chinese ptxP3 isolates.
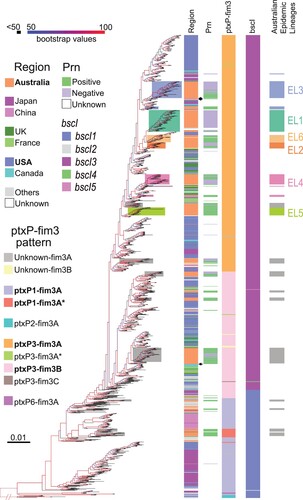
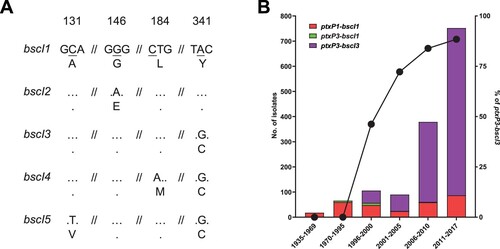
Figure 5. bscI alleles and their frequencies detected in 1452 sequenced B. pertussis isolates from across the globe. (A) bscI alleles with nucleotide and amino acid changes. The numbers at the top refer to the position of the underlined SNP, relative to the start of the bscI gene. Dots represent identical base or amino acid. The nucleotide sequence is shown in codons with the corresponding amino acid (in single letter format) shown below. (B) Number and percentage of ptxP3-bscI3 isolated since it was first detected in 1996. Red, green and purple bars depict the number of ptxP1-bscI1, ptxP3-bscI1 and ptxP3-bscI3 isolates. Twenty of the 1452 isolates were non-ptxP1/non-ptxP3 or non-bscI1/non-bscI3 and were not tallied in the graph. An additional 21 isolates had no collection date assigned and were also not tallied in the graph. The ptxP1-bscI1, ptxP3-bscI1 and ptxP3-bscI3 isolates were found across the globe. The line graph represents the rapid expansion of ptxP3-bscI3 strains.
Supplemental Material
Download Zip (890.4 KB)Data availability
All Illumina sequencing reads analysed in this study were deposited in the NCBI database. Raw reads were deposited under the project accession number PRJNA562796. In addition, the other five Illumina sequencing reads collected from 1997 to 2002 were deposited under PRJNA280658 and 78 isolates from 2013 to 2017 Australian epidemic study were deposited under PRJNA432286. The global B. pertussis genomes were downloaded from Sequence Read Archive (SRA) in NCBI by searching “Bordetella pertussis” by the date of 6th Nov 2018.