
Figures & data
Figure 1. Phylogenetic relationships of circulating rabies virus strains. (a) Phylogenetic tree of 2896 rabies viruses based on G gene sequences. The sequences were classified into ten clusters, named I–X. (b) A phylogenetic tree showing the relationships with the host and region. The branch colours represent the region, and the circles and animal pictures represent the hosts. Canine refers to rabies viruses isolated from dogs; although raccoon dogs and foxes are technically also canines, they are listed separately in this study. Other represents a small number of hosts that are less specific, such as donkey, pig, and some unknown hosts. In the clockwise direction, the circles show RABVs isolated from cats, raccoons, skunks, bats, cows, dogs (canine), ferret badgers, dogs (canine), humans, sheep (ovine), raccoon dogs, foxes, and dogs (canine).
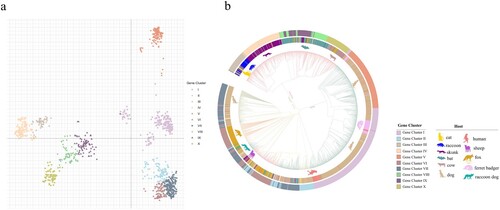
Figure 2. The infectivity of pseudotyped viruses. (a) A phylogenetic tree of 83 representative rabies viruses. (b) Infectivity cluster of 83 representative rabies viruses. (c) The infectivity of the different clusters. The Y-axis indicates the RLU values of different strains and represents the mean ± SD. Infectivity of different cluster strains was compared using the rank sum test, differences with P < 0.05 were considered statistically significant. *P < 0.05; **P < 0.01; ***P < 0.005; ****P < 0.0001.
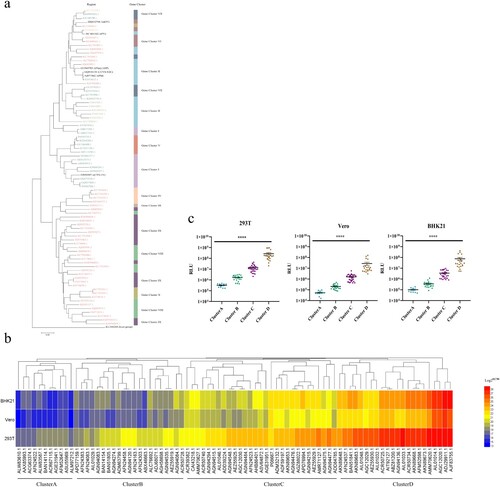
Table 1. Summary of the characteristics of the 83 rabies pseudoviruses in our library.
Figure 3. Antigenic evolution of circulating rabies viruses. (a) The neutralization activity of vaccine-elicited sera against rabies pseudoviruses. The EC50 values were determined against a panel of 83 pseudoviruses in our library. The black line represents the median value with interquartile range. (b) Antigenic cluster of 83 representative circulating rabies viruses. (c) The neutralization activity of vaccine-elicited sera against pseudoviruses from different antigenic clusters. The Y-axis indicates the EC50 values of different strains and represents the median with the interquartile range. Serum neutralization of different cluster strains was compared using the rank sum test, differences with P < 0.05 were considered statistically significant. *P < 0.05; **P < 0.01; ***P < 0.005; ****P < 0.0001.
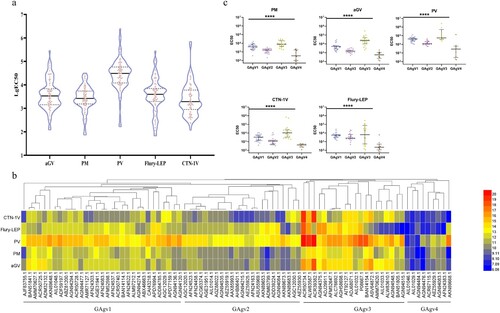
Figure 4. The correlations between phylogenetic relationships and infectivity or antigenicity. (a) The relationship between phylogenetic clusters and infectivity clusters. Assays in 293T, BKH21 and Vero cells reflect the relationship between phylogeny and infectivity. The X-axis shows the gene accession number of each strain, the Y-axis shows the RLU values (mean ± SD), the differently coloured columns show the different infectivity clusters. The colour scheme was the same as in (c). (b) The correlation between phylogenetic relationships and antigenicity. A phylogenetic tree of the viral strains was constructed based on sequence similarity. The information on antigenic, phylogenetic, and geographic clusters is showed in the phylogenetic tree. (c) The relationship between infectivity and antigenicity. The X-axis is split in four parts according to antigenic clusters, the Y-axis shows the median of the neutralization EC50 value of 14 vaccine-elicited sera, and the differently coloured spots indicate the different infectivity clusters. The colour classification is the same as in c.
Figure 5. Specific mutations affecting infectivity. (a) Cluster-specific amino acid substitutions. The sequences were aligned according to the four infectivity clusters and the significant amino acid mutations are marked in red. (b) The infectivity of four mutants in 293T, BHK21, and Vero cells. RLU values of the mutants were compared with the reference strain CVS-N2C. A 4-fold or greater difference was considered significant; all data are the means ± SEM from at least three replicates. Figure c. the G protein expression of three mutants in Vero cells. The y axis represents the G protein expression fold changes of the mutants when compared with the reference strain CVS-N2C.
Figure 6. Specific mutations affecting antigenicity. (a) Cluster-specific amino acid substitutions. The sequences were aligned according to the four antigenic clusters and the significant amino acid mutations are marked in red. (b) Decreasing reactivity of pseudotyped viruses carrying the four mutations to the 14 vaccine-elicited sera. The ratio of EC50 between mutants and the reference strain (CVS-N2C) was calculated and 4-fold or greater differences were considered significant. The column height represents the median of the EC50; error bars represent the SEM. (c) Structural simulation. The yellow position and the arrow show the amino acid mutation.