Figures & data
Figure 1. Generation of ACE2-PD saturation mutagenesis library and high-throughput screening. (a) Approach for establishment and screening of mutagenesis library. Oligo-synthesized saturation mutagenesis primers were used to construct a full-length human ACE2 lentiviral vector. Lentivirus () was transducted in HEK-293T cells and a mammalian cell mutant library (R0) was obtained after one round of FACS. After the incubation with SARS-CoV-2 S-RBD-mFc-FITC, a second round of FACS yielded RBD positive and negative groups (R+, R−). (b) FITC signal for different titres of WT-ACE2-expressing HEK-293T cells was added to RBD-mFc-FITC in growth medium. Bound RBD-mFC-FITC was measured by flow cytometry. Dashed lines indicate the different concentrations of two replicates. (c) FACS imaging for the cell mutant libraries in different concentrations of RBD protein: 2.4 nM RBD-mFc-FITC (left) and 4.8 nM RBD-mFc-FITC (right). (d) The ratio of amino acids' R+ and R− sequencing coverage. Full coverage indicated all intended mutant sites of amino acids were covered. −1 means 1 mutant site was missing, −2 means 2 were missing, and so forth. (e) Enrichment scores for ACE2 mutations highly agreed between two independent FACS experiments (Pearson's r = 0.71). (f) The distribution of enrichment scores of all detected mutations. The total number of mutant sites was 11,268 from 2 replicates (the mutant site may be missing in 1 replicate).
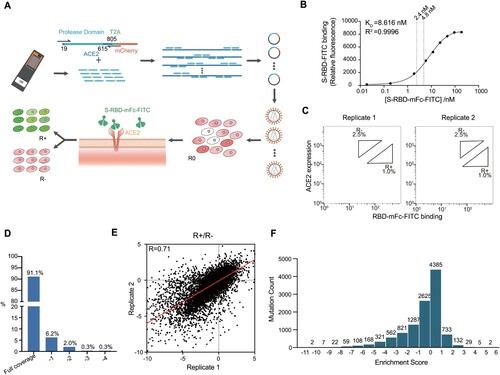
Figure 2. Full-length ACE2-PD enrichment heatmap. (a) ACE2-PD saturated mutagenesis heatmap and classification. Fitness scores based on the average Log2 enrichment ratios from two replications of the RBD sorts were plotted from depletion or deleterious (orange) to enriched (blue). Positions on ACE2 protein were shown on the horizontal–vertical axis, and amino acid substitutions are indicated on the vertical axis. Magnified views of ACE2 positions that directly interact with RBD (b) and glycosylation sites (d). Colouring schemes were the same as in (a). (c) Fitness scores were mapped to the structure (PDB: 6M0J) of RBD (green cartoon)-bound protease domain (surface). Residues conserved for RBD binding were shown in orange; mutationally tolerant residues were in pale colours; residues that were hot spots for enriched mutations were in blue. (e) Views looking down onto the ACE2 glycosylation sites (PDB: 6M17). The colouring scheme was the same as in (a).
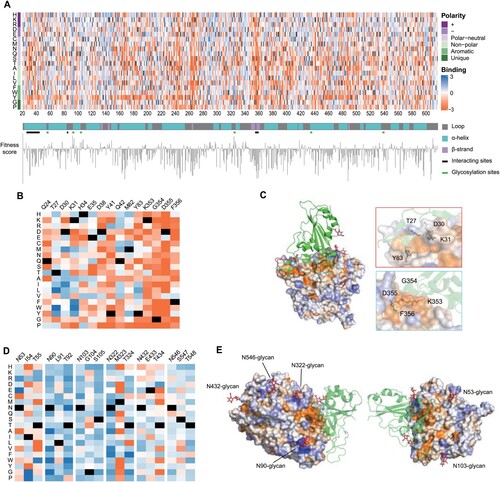
Figure 3. Analysis of antigenicity of SARS-CoV-2 variants using a panel of engineered ACE2 and neutralizing monoclonal antibodies. (a) The inhibition effect of WT-sACE2 (black) and C4-1 (pink) in SARS-CoV-2 variants entrance into ACE2 expressing HEK-293T cell lines. (b) The inhibition effect of monoclonal antibodies. Dashed lines indicate the neutralizing range of C4-1. Therapeutic effects for cocktails of C4-1 and monoclonal antibodies against beta (c), gamma (d), delta (e), and omicron (f) variants. Unpaired t-test was used to analyse differences between groups. *p<0.05, **, ***p<0.001, ****p<0.0001. EC
was calculated based on all dilutions of soluble ACE2 protein. The limit of EC
detection was 0–12000 ng/mL for panel A and 0–10000 ng/mL for panel b, c, d, e, and f. All results were obtained from three independent experiments. In each experiment, the infection assay was performed in duplicate wells. Data are mean ±SEM, n = 2 replicates.
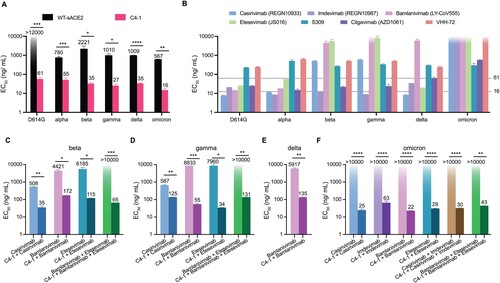
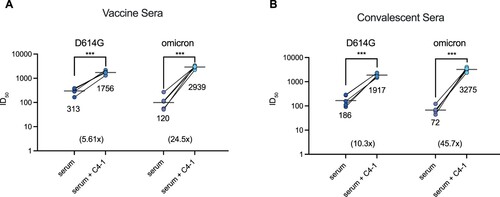
Figure 4. Enhanced serum neutralization against D614G and omicron pseudotyped virus by C4-1. The indicated pseudotyped viruses were incubated with dilutions of serum derived from individuals vaccinated with Rong'an vaccine or vaccine C4-1/serum mixture (a) and serum from COVID-19 patients or patients convalescent C4-1/serum mixture (b). The lines indicate the geometric mean ID. The limit of ID
detection was >30. Paired t-test was used to analyse differences between groups. ***p<0.001. Data are mean ±SEM, n = 2 replicates.