Figures & data
Figure 1. Study design and cohort summary.
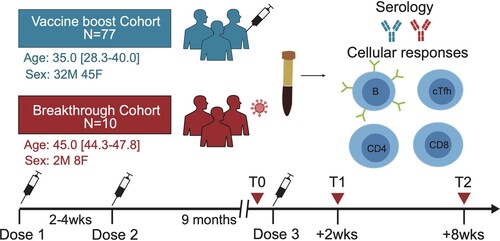
Table 1. Baseline clinical characteristics of the CoronaVac booster cohort and the breakthrough infection cohort.
Figure 2. Dynamic anti-RBD or anti-spike antibody responses before and after the third CoronaVac booster. (A-D) Enzyme-linked immunosorbent assay measurement for anti-RBD IgG titre (A), anti-RBD IgA titre (B), anti-spike IgG titre (C) and anti-spike IgA titre (D) at three different time points, including before the booster (T0), 2 weeks after the booster (T1), and 8 weeks after the booster (T2) for vaccine booster group. Serum from a breakthrough cohort was also included for analysis as control, which were obtained between day 13–18 post disease onset. Dotted lines indicated the lower limit of detection (LOD) for the assay. Data points on the bar graph represent individual titre and the line indicates geometric mean titre (GMT). GMTs and the seropositive ratios were noted on the top of each bar. (E–H) Fold change in anti-RBD IgG titre (E), anti-RBD IgA titre (F), anti-spike IgG titre (G), anti-spike IgA titre (H) specific to Delta or Omicron compared to that of ancestral strain for booster at T1 and T2 timepoint as well as for breakthrough cohort. For comparing antibody responses specific to different SARS-CoV-2 variants and at timepoints, two-tailed p values were determined using matched-pairs signed rank test with the Holm-Šídák multiple comparison correction. Unpaired Wilcoxon test for comparison between vaccine booster at T1 timepoint and breakthrough infection subjects. * p < .05, ** p < .01, *** p < .001, **** p < .0001; ns, no significant difference.
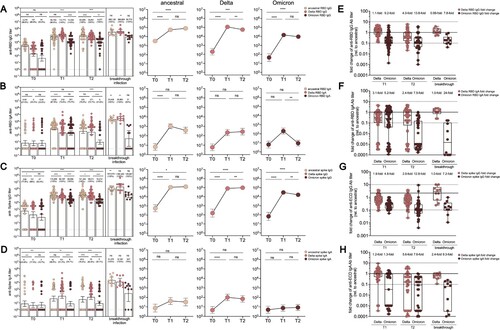
Figure 3. Serum neutralization activities in CoronaVac booster recipients and breakthrough infection cases. (A) Serum titres that achieved 50% peudovirus neutralization (ID50) in 77 CoronaVac booster recipients and 10 Delta breakthrough infection cases with prior 2-dose of CoronaVac. The vaccine sera were collected on day 14 post 2-dose and 3-dose of CoronaVac, respectively, while the breakthrough sera were obtained between day 13–18 post disease onset. The horizontal dotted lines indicate half the value of the lower limit of detection. Data points showed on the bar graph represent individual titre and the line indicates geometric mean titre (GMT). For pairwise comparison of serum samples collected after 2 and 3 doses, two-tailed p values were determined using matched-pairs signed rank test with the Holm-Šídák multiple comparison correction. Unpaired Wilcoxon test was used for comparison between groups. (B) Fold change in neutralization titre (ID50) for Delta and Omicron strain relative to that for D614G strain at different timepoint. The mean change fold was on the top of bar. (C) Correlation analysis of anti-RBD IgA or IgG responses specific to ancestral, Delta, and Omicron. (D) Correlation analysis of neutralization titre (ID50) against D614, Delta, and Omicron strain, correlation analysis of ID50 against Delta strain and anti-Delta spike IgG, and correlation analysis of ID50 against Omicron strain and anti-Omicron spike IgG or anti-Delta spike IgG responses. (E) Neutralization titres against D614G, Delta and Omicron strain among booster recipients under the age of 40 versus over the age of 40. (F) Neutralization titres against D614G, Delta and Omicron strains among low neutralizers after 2-dose CoronaVac versus high neutralizers after 2-dose CoronaVac. Correlation analysis for neutralization titres after 2 doses versus neutralization titres after 3 doses for D614G, Delta and Omicron strain. Correlation analysis was performed using nonparametric Spearman rank correlation. * p < .05, ** p < .01, *** p < .001, **** p < .0001; ns, no significant difference.
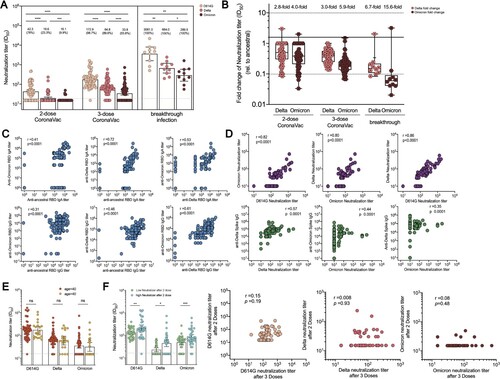
Figure 4. RBD-specific B cell responses and memory B cell subsets in vaccine cohort. (A)The frequency of RBD-specific B cells of total B cells over time in booster recipients at T0, T1 and T2 timepoint, and the frequency of B cells specific to ancestral RBD, Delta RBD, and Omicron RBD at T2 timepoint. Dotted lines indicated the limit of detection (LOD) for the assay. (B) The frequency of RBD-specific memory B cells of total memory B cells over time in booster recipients at T0, T1 and T2 timepoint. The frequency of memory B cells specific to ancestral RBD, Delta RBD, and Omicron RBD at T2 timepoint. (C–D) Fold change for the frequency of RBD-specific B cells (C) and RBD-specific memory B cells (D) recognizing Delta and Omicron strain relative to that of counterpart recognizing ancestral strain. Bars represent the average frequency of B cells, and positive rate was on the top of each bar. Wilcoxon matched-pairs signed-rank with two-tailed p-value was used for comparison between groups. * p <0.05, ** p <0.01, *** p <0.001, **** p <0.0001; ns, no significant difference.
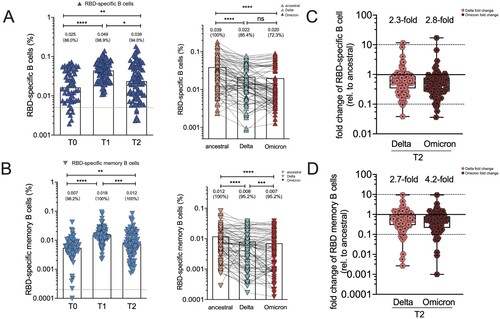
Figure 5. Spike-specific circulating follicular helper cell (cTfh) responses in vaccine cohort. (A) The frequency of cTfh responding to ancestral spike, Alpha spike, Delta spike and Omicron spike (T2 only) of total cTfh cells over time in booster recipients. Dotted lines indicate the lower limit of detection (LOD) for the assay. (B) Fold change for the frequency of cTfh cells recognizing Alpha, Delta and Omicron strain relative to that of counterpart recognizing ancestral strain. (C) Correlation analyses of Omicron spike-specific cTfh cells and ancestral spike-specific cTfh cells, Alpha Spike-specific cTfh cells, and Omicron spike-specific cTfh cells, respectively. (D) Dynamic change of spike-specific cTfh subpopulations at T0, T1 and T2 timepoint, including cTfh1, cTfh2, cTfh17 and cTfh1-17. Bars represent the average frequency of cTfh cells, and positive rate was on the top of each bar. Two-tailed p values were determined using matched-pairs signed-rank test with the Holm-Šídák multiple comparison correction between groups. * p < .05, ** p < .01, *** p < .001, **** p < .0001; ns, no significant difference.
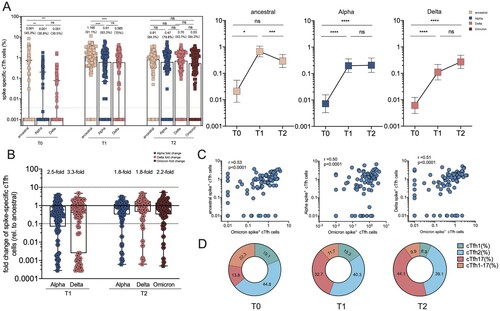
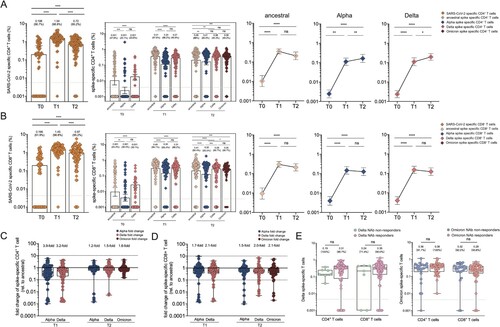
Figure 6. SARS-CoV-2 specific CD4+ and CD8+ T cell responses in vaccine cohort. (A–B) The frequency of SARS-CoV-2 specific CD4+ T cell (A) and CD8+(B) T cell responses over time in booster recipients. The frequency of CD4+(A) and CD8+(B) T cell responses responding to ancestral spike (T0-T2), Alpha spike (T0-T2), Delta spike(T0-T2), and Omicron spike (T2 only) over time in booster recipients. Dotted lines indicated the limit of detection (LOD) for the assay. (C-D) Fold change for the frequency of CD4+ T cells (C) or CD8+ T cells (D) recognizing Alpha, Delta and Omicron strain relative to that of counterpart recognizing ancestral strain. (E) Comparative analysis for the frequency of CD4+ T cells or CD8+ T cells specific to Delta strain among those booster recipients who do not generate neutralization antibody responses against Delta strain (Delta NAb non-responders) versus Delta NAb responders (left panel). Comparative analysis for the frequency of CD4 + T cells or CD8+ T cells specific to Omicron strain among those booster recipients who do not generate neutralization activities against Omicron strain (Omicron NAb non-responders) versus Omicron NAb responders (right panel). Bars represented median value, whereas median value and positive rate were on the top of each bar. When comparing T cell responses specific to different SARS-CoV-2 variants and at timepoints, two-tailed p values were determined using matched-pairs signed-rank test with the Holm-Šídák multiple comparison correction. Unpaired Wilcoxon test were used for comparison between vaccine booster at T1 timepoint and breakthrough infection subjects. * p < .05, ** p < .01, *** p < .001, **** p < .0001; ns, no significant difference.