Figures & data
Table 1. Characteristics of the study population.
Table 2. Characteristics of patients who entered in the inclusion criteria based on DLCO tertiles.
Figure 1. Molecular mechanisms associated with pulmonary function in survivors of SARS-CoV-2-induced ARDS. A) Volcano plot representing the p-value versus the fold change for each microRNA after comparison of DLCO tertiles. The red dot indicates significant differences. B) Prediction model based on Random Forest. On the left, the importance of the contribution of each microRNA to the model. On the right, the best combination of microRNAs selected by the algorithm to reduce the error. C) Correlation between microRNAs that composed the signature. D) Linear or nonlinear relationship between the levels of each microRNA that composed the signature and DLCO. The expression levels are expressed as log10 (2−ΔCq) for statistical purposes. E) Kyoto Encyclopedia of Genes and Genomes (KEGG) analysis (selected). F) Gene Ontology (GO) analysis (selected). The p-value denotes the significance of the molecular pathway or the biological process and the size of the points represents the number of genes involved. The false discovery rate adjusted p-value cutoff was 0.05.
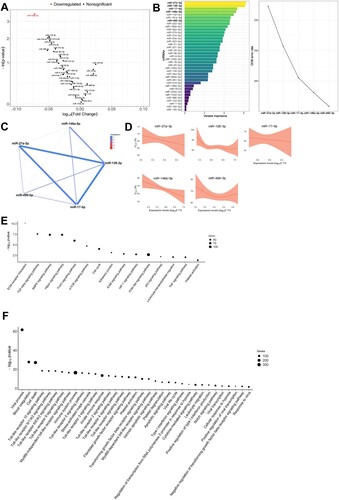
Table 3. Characteristics of patients who entered in the inclusion criteria based on TSS tertiles.
Figure 2. Molecular mechanisms associated with radiologic features in survivors of SARS-CoV-2-induced ARDS. A) Volcano plot representing the p-value versus the fold change for each microRNA after comparison of TSS tertiles. The red dots indicate significant differences. B) Prediction model based on Random Forest. On the left, the importance of the contribution of each microRNA to the model. On the right, the best combination of microRNAs selected by the algorithm to reduce the error. C) Correlation between microRNAs that composed the signature. D) Linear or nonlinear relationship between the levels of each microRNA that composed the signature and DLCO. The expression levels are expressed as log10 (2−ΔCq) for statistical purposes. E) Kyoto Encyclopedia of Genes and Genomes (KEGG) analysis (selected). F) Gene Ontology (GO) analysis (selected). The p-value denotes the significance of the molecular pathway or the biological process and the size of the points represents the number of genes implicated. The false discovery rate adjusted p-value cutoff was 0.05.
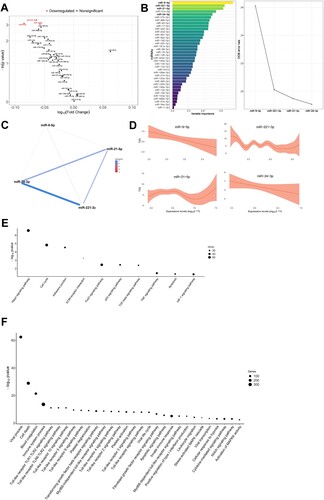
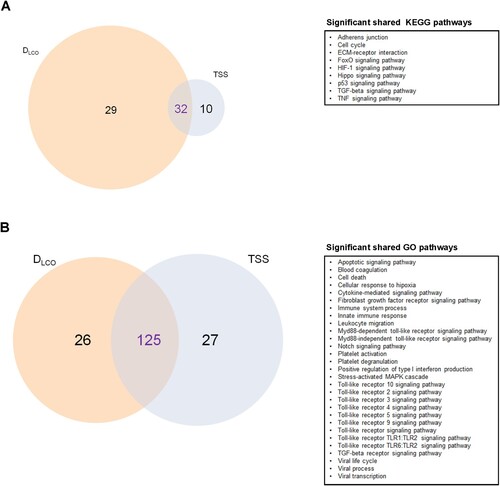
Figure 3. Molecular mechanisms associated with pulmonary function and/or radiologic features. A) Venn diagram displaying the shared and unique Kyoto Encyclopedia of Genes and Genomes (KEGG) pathways (selected). B) Venn diagram displaying the shared and unique Gene Ontology (GO) terms (selected). The size of each circle is proportional to the total number of molecular pathways or biological processes related to DLCO and TSS. On the right, significant shared KEGG pathways and GO terms are reported for each diagram.