Figures & data
Figure 1. Phylogenetic characterization of SFTSV S, M, and L segments sequenced from human patients. Maximum-likelihood trees for SFTSV S, M, and L genome segments (A). Seven viral clades indicated by coloured branch were identified from patients with SFTS in this study. The black branch indicates sequences downloaded from the GenBank. The outcome (surviving or death) of the patient was shown on the right side of the phylogenetic trees. Scale bars indicate a number of substitutions per site. Graphic representation of reassortment events in SFTSV genome sequences obtained from patients (B). The number beneath the reassortment graphics indicates the name of the virus isolates with detailed information in Appendix Table 2. The number and proportion of four common viral clades obtained from patients with SFTS in each studied year (C). Geographic distribution of four common viral clades from patients with SFTS (n = 712) residing in Xinyang City (D). The number in the middle of the circle indicates the region number where the patients reside, with detailed data shown in Table S7.
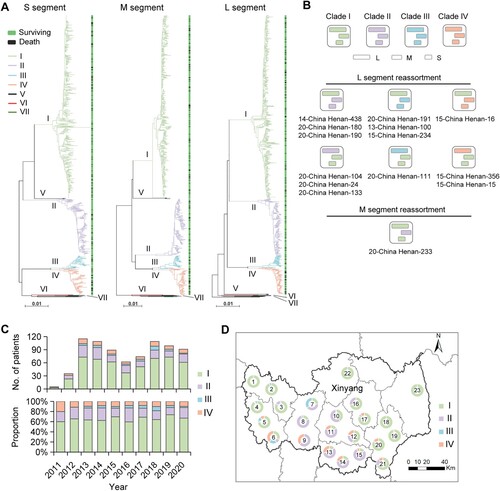
Figure 2. CFRs and viral loads of patients infected with four viral clades. Numbers and CFRs of patients (detailed in Table S8) infected with four viral clades were shown (A). Datapoints show CFRs; error bars show 95% CIs. Chi-square test or Fisher’s exact test was used to determine the difference of case fatality rate between groups. Survival curves of patients infected with four viral clades were shown (B). The Kaplan–Meier method was used to analyse time-to-event data, and statistical analysis results were shown in Table S9. Viral loads in patients infected with four SFTSV clades were shown (C). Horizontal and dotted lines indicate the mean value and IQR. ANOVA test was used as appropriate, to determine the difference between groups. Kinetics of viral loads in patients infected with four viral clades was shown (D). The number of patients who had serum viral loads tested was shown above each dot collection. The star indicates the statistical significance (p < 0.05) of the comparison of serum viral loads among the patients infected with four SFTSV clades determined by the ANOVA test. The dot indicates the exact value of the viral load, the horizontal line indicated mean value, and the bar indicates SD. CFR, case fatality rate; ns, no significance.
Figure 3. Levels of immune mediators in serum from patients infected with four viral clades. Serum levels of 45 immune mediators were compared between clade IV (n = 25) and each of the other three clades (I, n = 54; II, n = 32; III, and n = 15) (A). Comparison of serum concentrations of CXCL9, IL-10, IL-6, IP-10, M-CSF, and IL-1β, among patients infected with four viral clades (B), with detailed information in Table S16. Datapoints show exact values; horizontal lines show median values; error bars show interquartile range. Independent t-test and ANOVA test were used to determine the difference between two and multiple groups, respectively. *p < 0.05, **p < 0.01, and ***p < 0.001. HC, healthy control; ns, no significance.
Table 1. Amino acid mutations related to fatal outcomes in patients with SFTS.
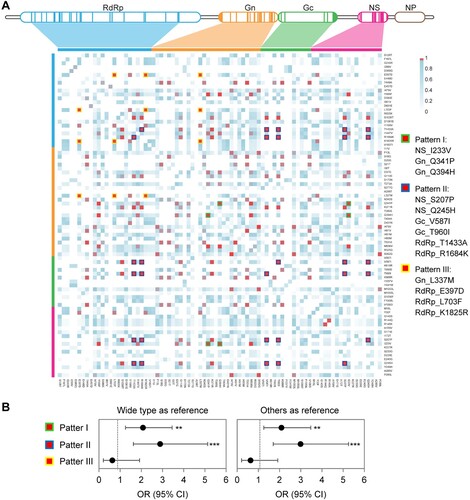
Figure 4. Co-mutation patterns in SFTSV strains from human patients. The matrix representation of co-mutation network for SFTSV strains obtained from patients with SFTS (A). Adjusted ORs for fatal outcomes in patients infected with SFTSV possessing co-mutation patterns (B). ORs were evaluated by using multivariate logistic regression models, with detailed information in Table S15. **p < 0.01, ***p < 0.001; OR = odds ratio.