Figures & data
Figure 1. Overview and stress-based selection of the S. Typhimurium transposon mutant library. (a) Circular diagram showing the distribution of transposon mutants within the S. Typhimurium genome in the library. The outer track (black) showed the full S. Typhimurium genome, the next two tracks (blue and cyan) showed the distributions of genes by DNA strand, and the inner track showed the number of reads per kb of the genome (white, 0 reads; orange, ≤ 10; magenta, ≤ 100; red, > 100). (b) Reproducibility of experimental protocols. The normalized reads of a single gene from two technical replicates were plotted. (c) Schematic representation of the Tn-Seq carried out in vitro and in model cell lines used in this study. In total, 106–108 colony forming units (CFUs) of the S. Typhimurium transposon mutant library were selected under 15 in vitro conditions. The RAW 264.7 and HeLa cells were infected by 5 × 10⁷ CFUs of the mutant library at the indicated MOIs for three rounds. The bacterial cells were collected and amplified after selection.
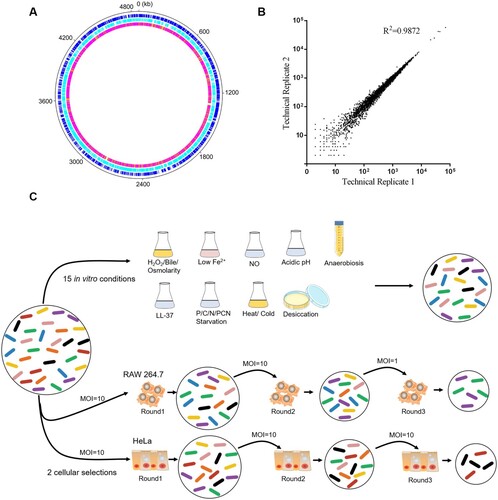
Figure 2. Visualization and comparison of gene essentiality under 17 stress conditions. Jitter plot showing the extent of mutant fitness costs calculated using the mean log2 FC across three replicates for each condition. The number of fitness determinants under each condition was labelled above the plot.
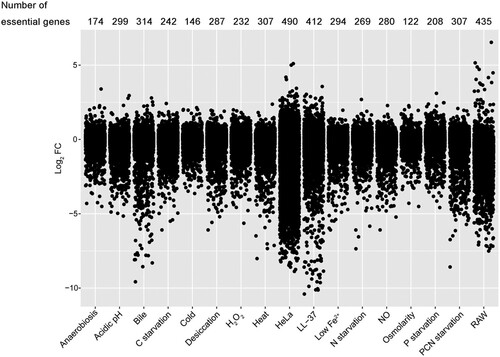
Figure 3. Interaction network between fitness determinants and conditions. A total of 1242 fitness determinants were visualized in a gene-condition interaction network. Conditions were represented as rounded squares and genes are represented as circles. The numbers in the circles correspond to the STM14 genome number. The sizes of the squares corresponded to the number of fitness determinants under each stress condition. The size of the circles increased with the number of interactions. Genes were colour-coded according to their functional category.
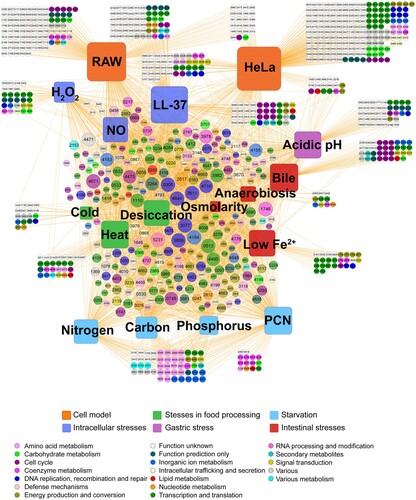
Figure 4. Analysis of fitness determinants under starvation stresses. (a) The Venn diagrams showed the numbers of fitness determinants under nutrient stress conditions. (b) Heatmap highlighting biologically relevant clusters. A cluster analysis was performed using the log2 FC values of the 61 genes that were shown to be essential under at least one starvation condition.
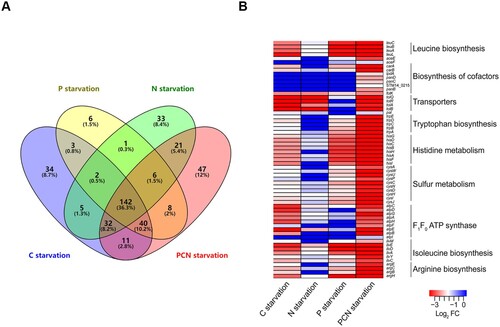
Figure 5. Differential essentiality analysis of genes between stomach-, intestine- and intramacrophage-mimicking niches. Analysis of essential gene networks identified in stomach-, intestine- and intramacrophage-mimicking niches. The pathways and protein complex included ATP synthesis pathway (a); ABC transporter (b); amino acids synthesis pathway (c). Genes were represented as ellipses and colour-coded according to their essentiality in mimicked niches. Gene interactions were indicated by the grey line. (d) A pathway-specific subnetwork indicating the shared fitness determinants between four intramacrophage-mimicking conditions (H2O2, NO, LL-37, and PCN starvation) and macrophage RAW 264.7 cells. Genes were colour-coded the same as in .
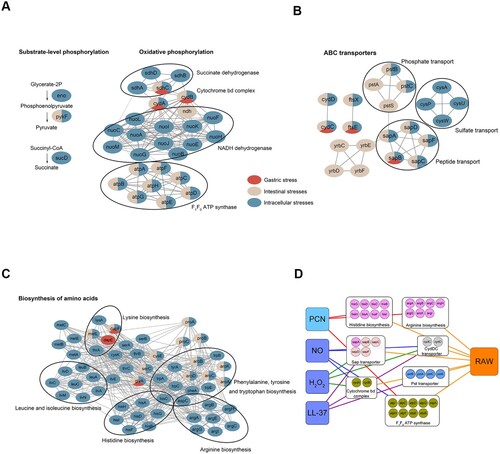
Table 1. Genes exhibiting general fitness costs during all the stress conditions.
Figure 6. Validation assays for survival and protein aggregation in S. Typhimurium lacking yheM. (a) The average log2FC values across genes were shown for each condition. (b) Validation of the in vitro and cellular Tn-seq screening. Bacteria were treated under the same stress conditions as selecting the transposon mutant library. Viable cell counts were determined after stress for indicated time by plating serial dilutions. The data represent the mean values and standard errors from three independent experiments. *p values < 0.05, **p values < 0.01, Student’s t-test. (c) Protein aggregates isolated from wild-type and ΔyheM treated at 37°C, 42°C, or 48°C. Total cell lysates were used to indicate identical protein concentrations between samples.
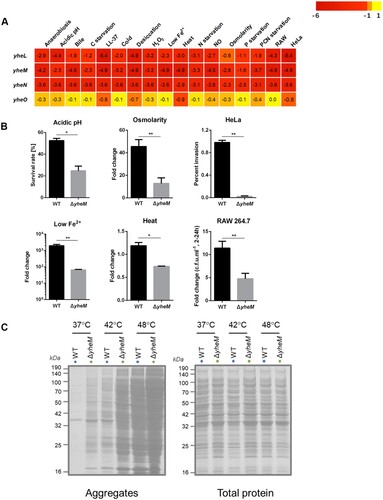
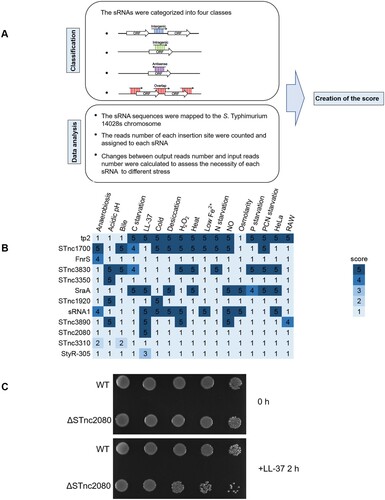
Figure 7. Essentiality analyses and verification of sRNAs in S. Typhimurium. (a) Flow-chart of the methods used for the sRNA analysis. (b) The sRNA scores under different stress conditions. (c) Overnight cultures of wild-type and ΔSTnc2080 cells in LB medium were diluted to OD600 of 0.1 in M9CA medium supplemented with 40 μg/ml LL-37. At the indicated time points, an aliquot of each culture was serially fivefold diluted and spotted onto LB plates. Plates were photographed after 14 h of incubation at 37°C.