
Figures & data
Figure 1. Flow chart for animal infections and RNA sequencing. Six macaques and mice were randomly divided into two groups and infected by C. neoformans H99 intranasally. Lung tissues were isolated 7 days post-infection. Total RNAs were isolated for mRNA-Seq and miRNA-Seq followed by confirmation of histopathology. A differentially expressed miRNA-mRNA regulatory network was subsequently constructed. This figure was created with BioRender.com.
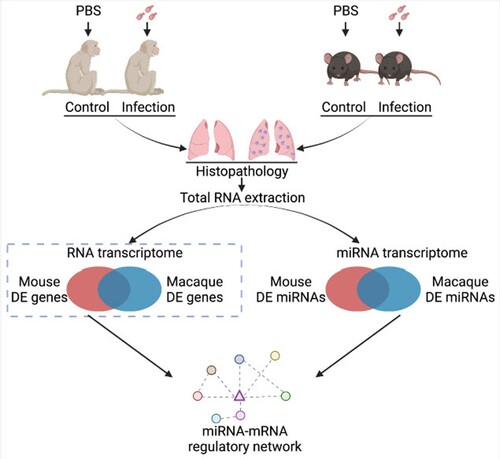
Figure 2. miRNA-Seq of mice and macaques in response to C. neoformans. A, B. Histopathology observation of infected macaque and mouse lung tissues. Lung tissues from macaques and mice were fixed, sectioned at 10 µm thickness and stained using mucicarmine. Red arrows indicate C. neoformans cells. Scale bar = 10 µm. C, D. PCAs of miRNA-Seq data. Read number of macaques and mice obtained from miRNA-Seq was used for PCA analyses. E F. Heatmaps of differentially expressed miRNAs. miRNAs with p-value 0.05 and fold change ≥2 were considered as differentially expressed.
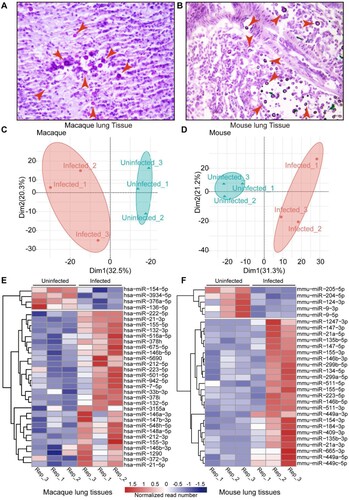
Figure 3. Core regulatory machinery of miRNA-mRNA network during C. neoformans infections. A. Schedule of identification of homologous miRNA. miRNAs of macaques were used for searching homologous miRNAs in miRbase. B. Venn diagram of differentially expressed miRNAs. C. Information of eight co-regulated miRNAs. D. RT-qPCR of the eight co-regulated miRNAs in mice. Three biological replicates were performed. An unpaired student’s t-test was performed to assess statistical significance; *p < 0.05, ** p < 0.01 and ***p < 0.005. E. miRNA-mRNA core regulatory network. Differentially expressed target genes of eight co-regulated miRNAs are shown. The whole network is presented in Figure S3.
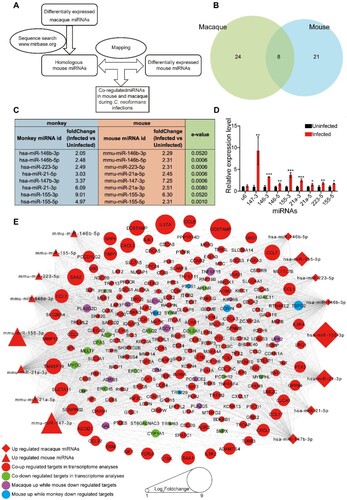
Figure 4. GO analyses of co-regulated miRNAs and mRNAs in macaque and mouse during C. neoformans infections. (A) GO terms of miRNAs calculated by miEAA. (B) GO terms of target mRNAs enriched by Clusterprofiler. Eight co-regulated miRNAs and co-regulated mRNAs from (E) were subjected to GO analyses, respectively. Top 10 or all significantly enriched GO terms were plotted. Green, blue, and red columns represent cellular component, molecular function, and biological process, respectively.
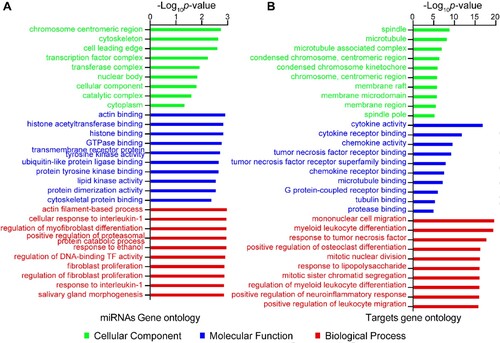
Figure 5. Macrophage “Trojan Horse” was enhanced in patients with HIV/AIDS. (A) Strategies for phagocytosis assessment by flow cytometry. Cryptococcal internalization was determined by flow cytometry using GFP-expressing C. neoformans H99. During flow cytometry, single cells were selected and cells with negative Uvitex 2B were considered as phagocytes, of which FITC-positive cells were fungi-internalized cells (Uvitex 2B -/ FITC +). (B) Number and percentage of monocytes between patients with HIV and healthy individuals from clinical data. (C) Phagocytosis effectivity of MDMs from patients with HIV and healthy individuals. (D) Correlation of phagocytosis and migration in MDMs from patients with HIV. E, F. Phagocytosis effectivity was inhibited by R10015 in TDMs (E) and MDMs (F). G, H. Cell migration was dampened by R10015 in TDMs (G) and MDMs (H). I, J. R10015 did not affect killing of C. neoformans in TDMs (I) and MDMs (J).
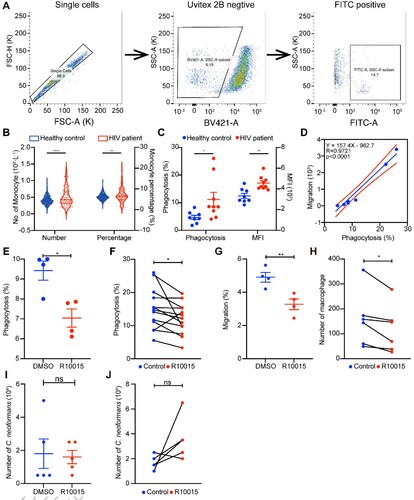
Figure 6. MYOC enhanced C. neoformans mediated macrophage “Trojan Horse.” A. miRNAs-mRNA network during C. neoformans infections. B. Normalized MYOC reads in mice and macaques in response to C. neoformans. C. Intensity of MYOC protein from comparative proteomes between HIV and AIDS patients. D. Relative expression level of MYOC in MYOC-gene-edited THP-1 cell lines. Unpaired Student t test was performed (n = 4). * p < 0.05. E. Western blot analysis of MYOC(n = 3). Full blots are shown in Supplementary Figure S4. F. Quantitative analyses of a western blot for MYOC. GAPDH was used as an internal control. Unpaired Student t-test was performed (n = 3). * p < 0.05. G. Effectivity of phagocytosis in MYOC-overexpressing TDMs by flow cytometry. Unpaired Student t test was performed (n = 4). * p < 0.05. H. Effectivity of phagocytosis in MYOC-edited TDMs by confocal microscopy. TDMs were incubated with GFP-expressed C. neoformans, and phagosomes were washed, fixed and stained by F-actin and analyzed through confocal microscopy. Green represents C. neoformans, while red represents F-actin. Dots of green in the circle of red indicate phagocyted C. neoformans cells. Scale bar = 20 µm. I. Quantitative analyses of phagocytosis capacity by confocal microscopy. TDM cells and fungal cells were counted by imageJ, and the percentage of phagocyted TDMs and the number of intracellular C. neoformans were calculated. Unpaired Student t test were performed (n = 3). * p < 0.05. J. Killing tests of MYOC-overexpressing TDMs. Unpaired Student t test was performed (n = 3). * p < 0.05.
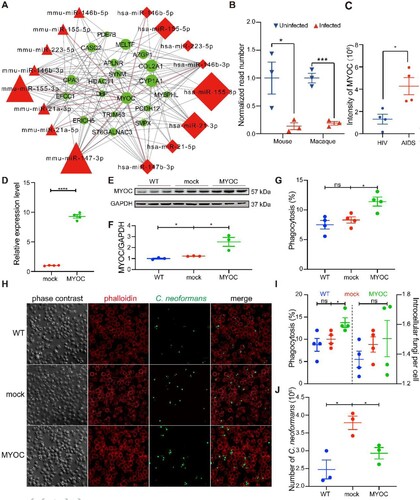
Figure 7. MYOC enhanced C. neoformans brain invasion in MYOC-transgenic mice. A. Photo of MYOC-transgenic mice. One of the MYOC-transgenic mice at 5 weeks old. B. MYOC gene fragment was checked by agarose electrophoresis in MYOC-transgenic mice. Genomic DNA was isolated and then PCR and electrophoresis were performed. Target PCR product was 498 bp. C, D. CFU assessments of brain (C) and lung (D) tissues in MYOC-transgenic mice. Seven MYOC-transgenic mice (three male and four female) and eight wild-type mice (four male and four female) from the same cages were used for CFU assays. An unpaired Student’s t-test was performed to assess statistical significance; * p < 0.05. E. Survival tests of MYOC-transgenic mice. Eleven MYOC-transgenic mice (five male and six female) and nine wild-type mice (three male and six female) from the same cages were used for survival assays. Log-rank (Mantel-Cox) test was employed for statistical analysis; * p < 0.05.
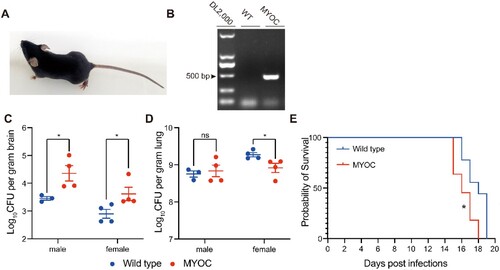
Figure 8. Conceptual graph of HIV-triggered CM. HIV-1 infections trigger cytoskeleton dynamics by induction of MYOC protein, enhance the macrophage “Trojan Horse” and induce CM (shown in blue lines). Inhibition of cytoskeleton pathways or MYOC dampens the “Trojan Horse” and decreases the number of cryptococci in the brain (shown in red lines). was created with BioRender.com.

Supplemental Material
Download Zip (44.6 MB)Data availability statement
The RNA-Seq raw data files were previously deposited in the National Center for Biotechnology Information (NCBI) Gene Expression Omnibus (GEO) with GEO Series accession ID GSE122785 [Citation22]. Raw data of microRNA-Seq is available to researchers and can be provided upon request.
This manuscript has been posted to a preprint server bioRxiv with the DOI: https://doi.org/10.1101/2022.02.14.480.319.