Figures & data
Figure 1. The number of patients included in the study according to the day after the onset of illness when serum specimens in the first phase of TBE, and serum and CSF specimens in the second phase of TBE were obtained.
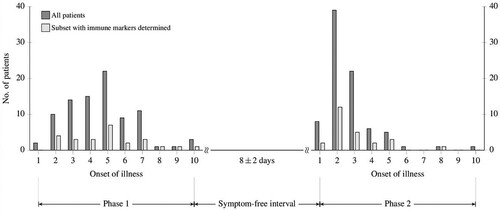
Table 1. Comparison of laboratory findings in patients with the initial and the second (meningoencephalitic) phase of tick-borne encephalitis.
Table 2. Comparison of levels of cytokines/chemokines in serum and cerebrospinal fluid in 25 patients with the initial and second (meningoencephalitic) phase of tick-borne encephalitis.
Figure 2. Laboratory results for each individual patient in the first (blue circles) and the second phase of TBE (green circles) in the ascending order according to the findings in the initial phase of illness. Values for patients for whom only results in the second phase of the disease were available are shown on the far right of the images. Dashed lines represent normal ranges for white blood cell counts and thrombocytes, and upper normal level for CRP and liver enzymes.
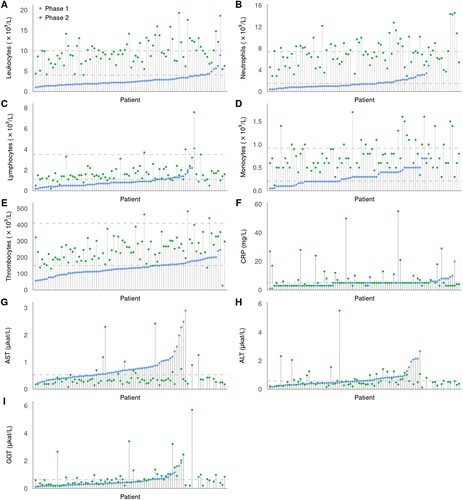
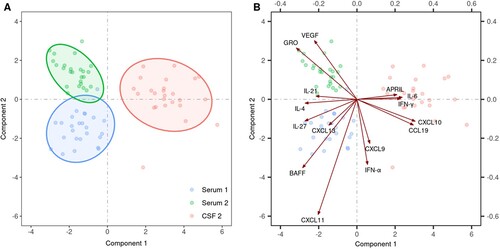
Figure 3. Comparison of the levels of 29 cytokines/chemokines in 25 patients with biphasic course of TBE performed by exploratory modelling using sparse partial least squares regression combined with discriminant analysis (sPLSDA). (A) shows an individual plot of sparse PLS-DA with the first two PLS components of immune mediators in serum of the initial phase of TBE (blue dots, Serum 1), in serum of the second phase of the disease (green dots, Serum 2), and in CSF of the second (meningoencephalitic) phase of TBE (red dots, CSF 2). The biplot in (B) extends the left panel by considering the contributions of the 15 most discriminative mediators between the three groups, with the length of the arrows corresponding to the importance of the mediator.