
Figures & data
Figure 1. Monthly distribution of CNS infections among children in Thai Binh Pediatric Hospital, Viet Nam from 01/01/2015 to 31/12/2020 (black bars: period of current study) (A) and daily distribution of CNS infections among children in Thai Binh Pediatric Hospital, Viet Nam during the study period (B)
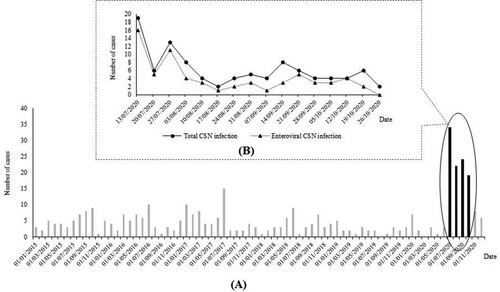
Table 1. Clinical definition and classification of CNS infection based on laboratory features of CNS infections among children.
Table 2. Characteristics of included patients.
Table 3. Pathogens identified in 99 included children.Table Footnote1
Figure 2. Phylogenetic tree based on partial VP1 gene sequences obtained in the present study. The sequences with the highest BLAST scores recovered from the NCBI GenBank nucleotide sequence database (http://www.ncbi.nlm.nih.gov/nucleotide/), indicated by BBH for best BLAST hit, for each sequence obtained here (indicated by a label starting by “Sample no.”) were incorporated in the phylogeny reconstruction. Alignment positions corresponded to coordinates 2462–2636 of sequence GenBank accession no. AF132497.1. Nucleotide alignments were performed using the ClustalW program with the BioEdit software v7.0.9.0 [Citation11], and the evolutionary history was inferred in the MEGAX v10.2.6 software (http://www.megasoftware.net/) using the Neighbour-Joining method and the Kimura 2-parameter method. The percentage of replicate trees in which the associated taxa clustered together in the bootstrap test (1000 replicates) is shown next to the branches. The tree is drawn to scale, with branch lengths in the same units as those of the evolutionary distances used to infer the phylogenetic tree. The scale bars indicate the number of nucleotide substitutions per site. Bootstrap values >50% are labelled on the tree.
![Figure 2. Phylogenetic tree based on partial VP1 gene sequences obtained in the present study. The sequences with the highest BLAST scores recovered from the NCBI GenBank nucleotide sequence database (http://www.ncbi.nlm.nih.gov/nucleotide/), indicated by BBH for best BLAST hit, for each sequence obtained here (indicated by a label starting by “Sample no.”) were incorporated in the phylogeny reconstruction. Alignment positions corresponded to coordinates 2462–2636 of sequence GenBank accession no. AF132497.1. Nucleotide alignments were performed using the ClustalW program with the BioEdit software v7.0.9.0 [Citation11], and the evolutionary history was inferred in the MEGAX v10.2.6 software (http://www.megasoftware.net/) using the Neighbour-Joining method and the Kimura 2-parameter method. The percentage of replicate trees in which the associated taxa clustered together in the bootstrap test (1000 replicates) is shown next to the branches. The tree is drawn to scale, with branch lengths in the same units as those of the evolutionary distances used to infer the phylogenetic tree. The scale bars indicate the number of nucleotide substitutions per site. Bootstrap values >50% are labelled on the tree.](/cms/asset/e3c4d46a-8271-4773-9ab6-fd33a07b2b77/temi_a_2088405_f0002_oc.jpg)
Table 4. Univariate and multivariate analysis of potential factors associated with the detection of a pathogen in CSF samples.
Table 5. Treatment and outcomes of children admitted for central nervous system infection.