Figures & data
Figure 1. Summary of participants. The primary efficacy analysis was performed based on the modified intent-to-treat (mITT) set. A total of 10,241 eligible participants were randomly assigned to receive V-01 vaccine or placebo. After a 2-month follow-up, 4,935 participants in the V-01 vaccine group and 4,934 in the placebo group were included in the MITT. Of these, 199 and 221 participants in V-01 vaccine and placebo group, respectively, formed the immunogenicity analysis set, blood samples were obtained at baseline and at days 14 and 28 to assess the anti-SARS-CoV-2 neutralizing antibody titres.
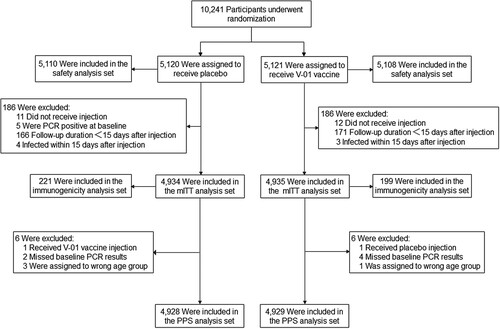
Table 1. Characteristics of participants at baseline according to ITT principle.
Figure 2. Efficacy of heterologous boost with V-01 vaccine preventing COVID-19 in subgroup according to mITT analysis. Vaccine efficacy was defined as the percentage reduction in the hazard ratio of V-01 vaccine group to the placebo group for the confirmed COVID-19. A stratified Cox proportional hazards model adjusting for covariates was applied to estimate the efficacy as well as its confidence interval.
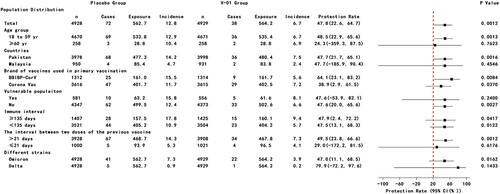
Figure 3. Virus-neutralizing titres pre- and post-booster. Serum was obtained before booster (day 0), 14, and 28 days after the booster vaccination. The neutralizing activity against ancestral strain was quantified by micro-dose cytopathogenic effect assays, with a limit of detection (LOD) of 10. The number above the scatter bars is the GMT for the group.
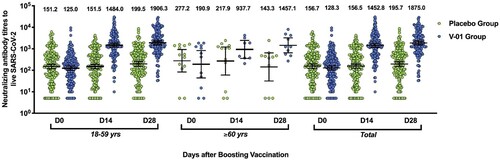
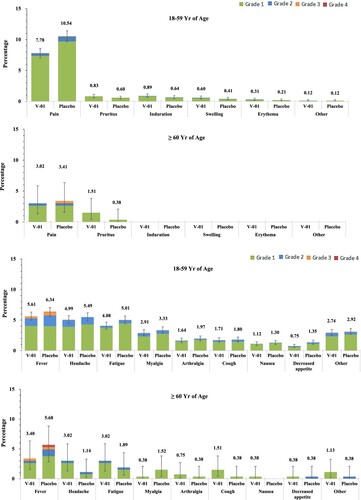
Figure 4. Solicited Local and Systemic Adverse Events. Solicited local and systemic reactions were collected by diary cards within 7 days after booster from participants in the safety analysis set (5,108 and 5,110 participants in V-01 and placebo group, respectively). Solicited local reactions are shown in Panel A, and solicited systemic reactions are shown in Panel B. Each vertical bar represents the percentage of participants who reported the specified reaction with a 95% confidence interval.