Figures & data
Figure 1. Outbreaks and epidemiologic timeline of H5 avian influenza. (a) The number of outbreaks caused by different subtypes of H5 viruses between January 1, 2020 and April 1, 2022. (b) The epidemiologic timeline of H5N1 and H5N8 viruses from January 1, 2020 to April 1, 2022. The epidemiology raw data for H5 highly pathogenic avian influenza over the indicated time period were downloaded from EMPRES-i + (https://empres-i.apps.fao.org/epidemiology).
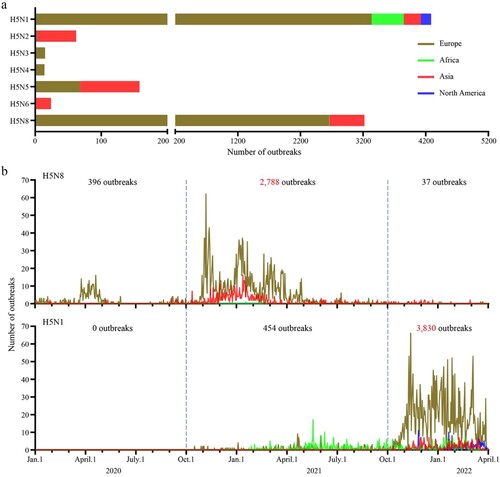
Table 1. H5N1 viruses bearing the clade 2.3.4.4b HA gene isolated in this study.
Figure 2. Phylogenetic relationship of the globally circulating H5 viruses. Bayesian time-resolved phylogenetic tree of the HA gene of 263 H5 viruses, including the 13 novel H5N1 viruses sequenced in this study and 250 H5 representative viruses downloaded from the GISAID EpiFlu Database (220 H5N1 viruses, eight H5N6 viruses, and 22 H5N8 viruses). The phylogenetic tree of the HA gene with more complete information is shown in Supporting Figure S1. The full name and location in the tree of the 13 H5N1 viruses detected in China are indicated in the Figure. The genotypes of the 233 H5N1 viruses were determined based on the diversity of their NA and internal genes, which are shown in Supporting Figure S2, and the closest gene donor of the NA and internal genes of these viruses are indicated in . The eight bars represent the eight gene segments, and the colour of the bar indicates the closest donor strain of the gene segment. Detailed information about the host species in which the virus in each genotype was detected is provided in Supporting Table S1; detailed information about the country where the virus in each genotype was detected is provided in Supporting Table S2.
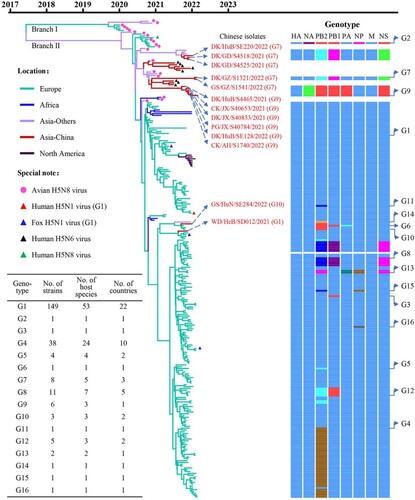
Figure 3. The spatiotemporal spread of H5N1 viruses. (a). Time and location where each genotype of H5N1 virus was detected. The countries in each continent where the viruses were detected are shown in Table S2. (b) Genotypic relationship of the H5N1 viruses. The eight bars represent the eight gene segments (from top to bottom: PB2, PB1, PA, HA, NP, NA, M, and NS); the colour of the bar indicates the closest donor strain of the gene segment.
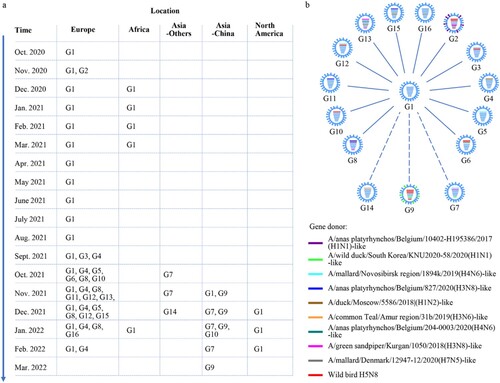
Figure 4. Replication and virulence of H5N1 viruses in mice. (a) Virus titers in organs of mice inoculated intranasally with 106 EID50 of different H5N1 viruses. Three mice from each group were euthanized and their organs were collected on day 3 post-inoculation for virus titration in eggs. Data shown are means ± standard deviations. The dashed line indicates the lower limit of detection. (b) Death pattern and MLD50 values of the indicated viruses.
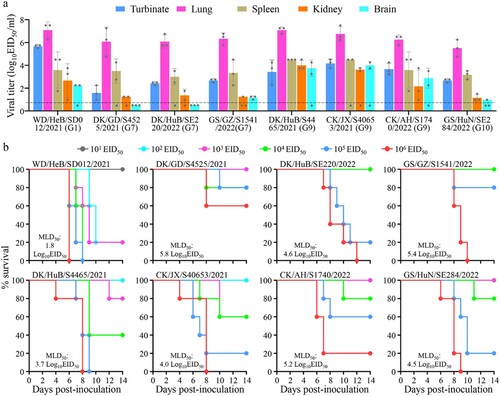
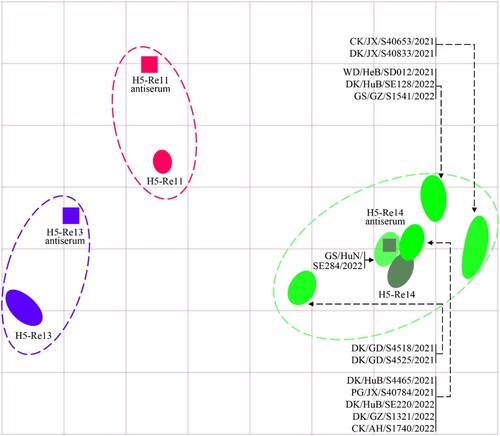
Figure 5. Antigenic cartography of H5N1 viruses. The antigenic map was generated by using the HI assay data shown in Table S4. Each unit in the coordinate represents a 2-fold difference in HI titer. The squares represent the antisera generated from the indicated viruses. The different coloured ovals show the viruses used for antisera generation and the test viruses.