
Figures & data
Figure 1. Prevalence of CRAB strains in different provinces of China. (a) The prevalence of CRAB strains recovered from the faecal swabs of patients in different provinces of China. (b) The prevalence of CRAB strains recovered from the respiratory samples of patients in different provinces of China. Different shades of colour represent different prevalence levels of carbapenem resistance.
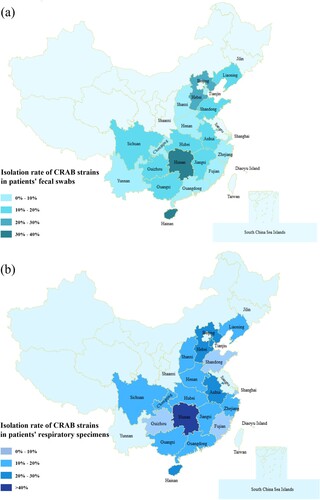
Figure 2. Antimicrobial susceptibility of 245 CRAB strains isolated from ICUs. IMP, imipenem; MEM, meropenem; CAZ, ceftazidime; SXT, trimethoprim/sulfamethoxazole; TZP, piperacillin/tazobactam; CAV, ceftazidime–avibactam; PIP, piperacillin; FEP, Cefepime; CHL, chloramphenicol; CST, colistin: TGC, tigecycline; CIP, ciprofloxacin; GEN, gentamicin: AMK, amikacin; TET, tetracycline; SCF, cefoperazone–sulbactam. Interpretations of resistance phenotypes follow those of the CLSI (Clinical and Laboratory Standards Institute) M100-S26 document.
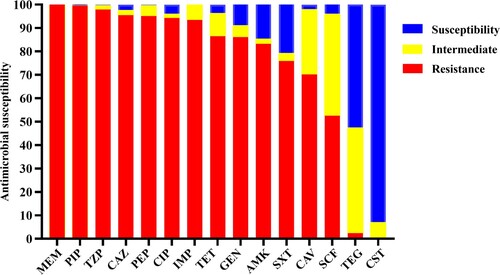
Table 1. Genetic characteristics and antimicrobial susceptibility of CRAB strains tested in this study.
Figure 3. Phylogenetic tree of 245 CRAB strains collected from ICUs in various parts of China during the period July to September 2020. Circle 1 depicts strains isolated from various provinces or municipal cities in China; Circle 2 denotes distribution of MLST types. Strains in each clade are depicted in the same colour and are regarded as clonally disseminated. Circle 3 depicts 5 ICUs in which four or more clones were recovered.
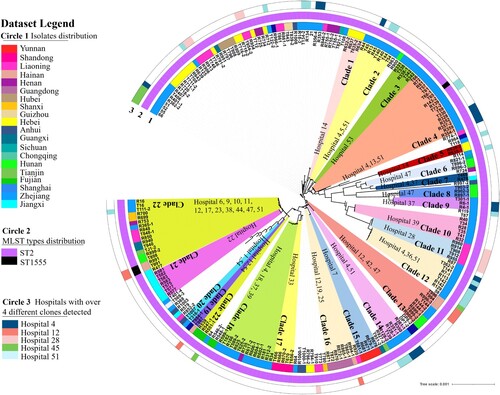
Figure 4. Minimum spanning tree constructed on the basis of cgMLST allelic genes of 245 CRAB strains isolated from ICUs in China. Each circle depicts an allelic profile based on sequence analysis of 2050 cgMLST genes. The length of the connecting lines represents the number of target genes with different alleles. (a) Colours of the circles denote different cgMLST types. Closely related genotypes (less than 10 alleles difference) are shaded in same node, and clusters are numbered consecutively (1–40). Red arrows indicate that strains belonged to ST1555, the remaining strains are all identified as ST2 type (b) Colours of the circles represent different isolation sources.
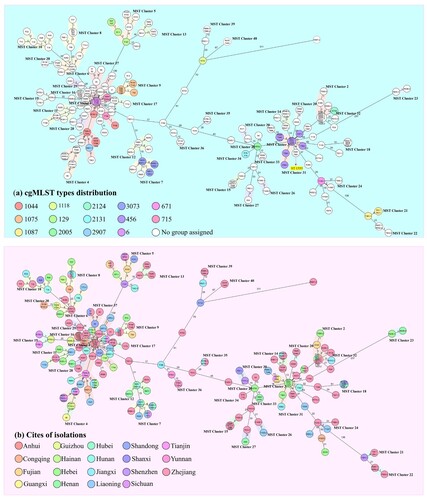
Figure 5. AMRs gene analysis of 245 CRAB strains collected nationwide in China. Heatmaps were obtained by aligning the draft genome sequence of each strain to the AMR gene database. Acinetobacter baumannii are clustered using a maximum likelihood tree. Red and light cyan blue depict the presence and absence of AMRs in the test strains, respectively. The right side denotes the category of AMRs. The colour bar above depicts the geographical distribution of CRAB isolates, with each region being shown by a specific colour in the dataset legend.
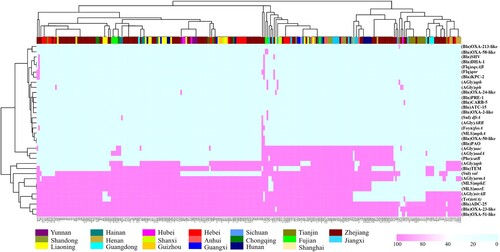
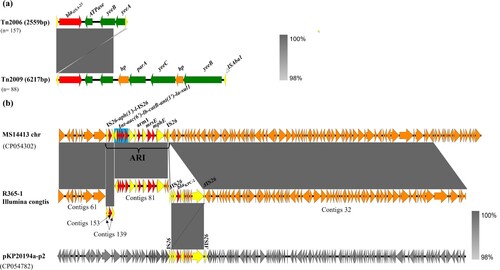
Figure 6. Genetic environment of acquired blaOXA–23 and blaKPC-2 elements in CRAB isolates created by Easyfigure. (a) Structure alignment of Tn2006 and Tn2009. Red depicts blaOXA-23 genes; Green and yellow denote putative functional protein and insertion sequence, respectively. (b) Linear alignment of chromosomal fragments MS114413-chr, R365-1 matching Illumina contigs and plasmid pKP20194a-p2. Mobile elements are highlighted in yellow and drug-resistance gene are depicted by red arrows. Blue frame depicts class I integron. Plasmid backbone of pKP20194a-p2 is highlighted in grey.
Supplemental Material
Download MS Word (534.6 KB)Data availability
The whole genome sequencing data in this study have been deposited in GenBank under BioProject ID PRJNA734772.