Figures & data
Figure 1. The diagnosis and treatment of Bartonella vinsonii infection. The lesion around the right knee was shown in (A), and red spots were seen on the right (B) and left leg (C) of the patient. mNGS results were shown in (D) and fluorescent PCR results were displayed in (E), in which blood samples collected from days 11, 13 and 14 after admission were shown as amplification curves 1 (red), 2 (green) and 3 (orange), respectively. Negative control was shown as curve 4 (dark blue). Sanger sequencing alignment was shown in (F). Haematoxylin and eosin (H&E) staining of biopsy tissue was shown in (G). Improvement of the right knee lesion was shown in (H) and the temperature chart of the patient during hospitalization was shown in (I).
![Figure 1. The diagnosis and treatment of Bartonella vinsonii infection. The lesion around the right knee was shown in (A), and red spots were seen on the right (B) and left leg (C) of the patient. mNGS results were shown in (D) and fluorescent PCR results were displayed in (E), in which blood samples collected from days 11, 13 and 14 after admission were shown as amplification curves 1 (red), 2 (green) and 3 (orange), respectively. Negative control was shown as curve 4 (dark blue). Sanger sequencing alignment was shown in (F). Haematoxylin and eosin (H&E) staining of biopsy tissue was shown in (G). Improvement of the right knee lesion was shown in (H) and the temperature chart of the patient during hospitalization was shown in (I).](/cms/asset/72ab3c3d-e7e9-4dd2-8ee7-037f77d50e97/temi_a_2094287_f0001_oc.jpg)
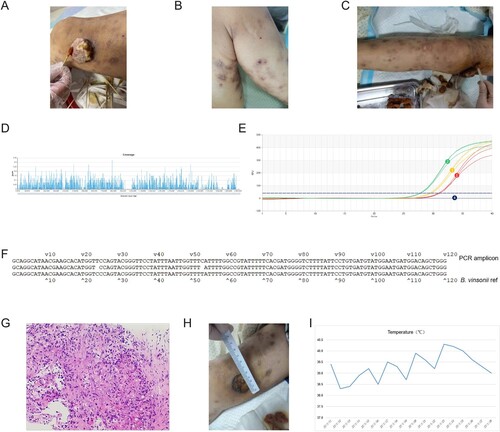
Table 1. Laboratory results of the patient after admission.