
Figures & data
Figure 1. In vitro characterization of the binding between the 5HB proteins and HR2P. (A) Schematic representation of the protein-engineering strategy used to yield the 5HB proteins. SP, signal peptide; NTD, N-terminal domain; RBD, receptor-binding domain; HR1 (heptad repeat 1), HR2 (heptad repeat 2); TM, transmembrane domain; CT, cytoplasmic tail. (B) Solution behaviours of 5HB proteins, including 5HB-H1, 5HB-H2, 5HB-H3 and 5HB-H4, on a Superdex 200 increase 10/300 column. The UV absorbance curves were recorded at 215-nm due to the lack of aromatic residues in 5HB proteins. The inset figure shows the SDS-PAGE analyses of the pooled samples. (C) CD spectra of the 5HB proteins to show their helical structures. (D) Binding of HR2P to the indicated 5HB proteins characterized by ITC.
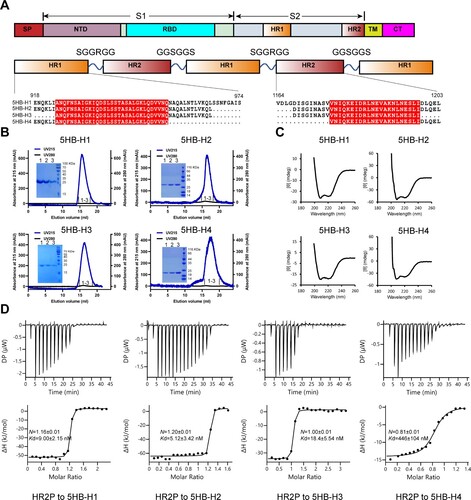
Figure 2. The entry-inhibition activity of the 5HB proteins. (A) Representative images of the S-mediated syncytia formation in the presence of the indicated 5HB proteins (5HB-H1, 5HB-H2, 5HB-H3 and 5HB-H4) or peptides (HR2P and EK1) at the concentration of 10 μM. PC, positive control, 293T/EGFP/S cells with 293T-hACE2 cells. NC, negative control, only 293T/EGFP/S cells. White arrows indicated the fused syncytia. Scale bar: 200 μm. (B) Inhibitory activity of 5HB proteins and peptides on SARS-CoV-2 S-mediated cell-cell fusion. Data are means ± SD of triplicate samples. (C-G) Inhibitory activity of the 5HB proteins (5HB-H1, 5HB-H2, and 5HB-H3) in the pseudovirus infection assays against SARS-CoV-2 of both the prototype (C) and the variant viruses, including B.1.351 (D), B.1.617.1 (E), B.1.617.2 (F), and B.1.1.529 (G), respectively. Inhibition of viral entry was measured according to the reduction in luciferase activities. Data are expressed as means ± SD.
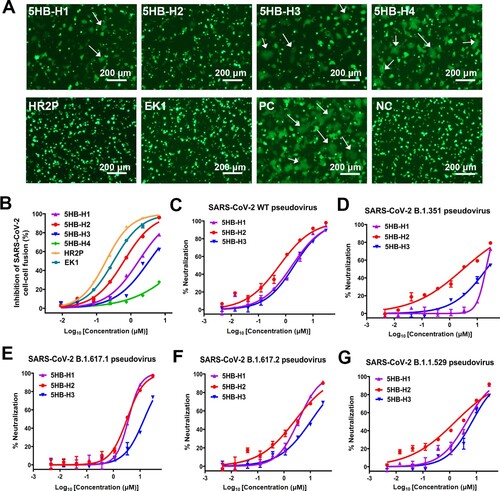
Table 1. Fusion-inhibitory activity of 5HB proteins.
Figure 3. 5HB proteins bind both wild-type S and pre-fusion S of SARS-CoV-2. (A-B) Flow-cytometric analysis of binding between SARS-CoV-2 wild-type S (A) or pre-fusion S (B) expressed on the 293T cell surface and 5HB proteins or Trx-HR2 or Trx-EK1 at 1 μM (left). Mean fluorescence intensity was measured with the 10-fold diluted proteins (right). Live cells and single cells were firstly gated. The ratio of stained cells was recorded by flow cytometry. PBS was used as a negative control. (C) A proposed model of SARS-CoV-2 5HB in viral entry inhibition compared with HR2P and EK1. The upper panel shows the process of SARS-CoV-2 spike transition from the pre-fusion conformation to the post-fusion conformation; the lower-left panel highlights the capacity of 5HB to bind pre-S trimer; the lower-right panel shows that HR2P and EK1 peptides cannot bind pre-S trimer. FP (fusion peptide in N-terminal), HR1 (heptad repeat 1), HR2 (heptad repeat 2), TM (transmembrane region).
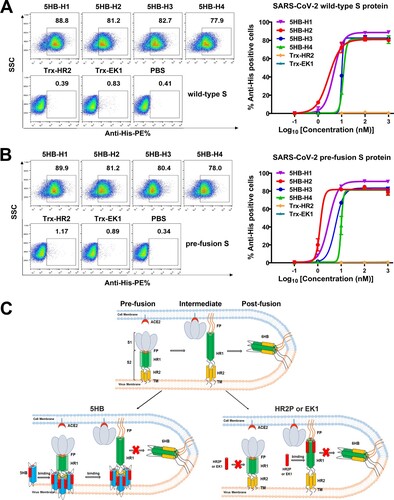
Figure 4. Bio-layer Interferometry sensorgrams and binding affinities of 5HB-H2 with HR2P at pH 7.5, 6.0, 5.5, 5.0 and 4.5, respectively. Three independent experiments are performed and the recorded profiles from one representative experiment are shown. The slow-on/slow-off kinetic data are analyzed by the 1:1 binding model. The calculated kinetic parameters are summarized.
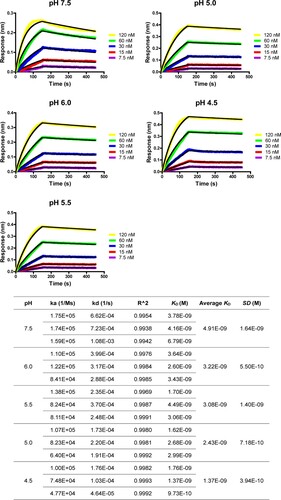
Figure 5. Structure of 5HB-H2/HR2P complex. (A) Overall structure of the 5HB-H2/HR2P complex shown in cartoon. 5HB-H2 are coloured in cyan and HR2P in yellow. Structures in the side view (upper) and top view (lower) are presented. (B) Structural alignments of the 5HB-H2/HR2P complex with SARS-CoV-2 6HB (left) and SARS-CoV 6HB (right). 5HB-H2/HR2P is shown in grey, SARS-CoV-2 6HB in magenta, and SARS-CoV 6HB in blue. (C) The hydrophobic groove between the 5HB-H2 and HR2P. The electrostatic surface of 5HB-H2 is presented. HR2P peptide is shown in cartoon. (D) The detailed hydrophobic interactions between 5HB-H2 and HR2P. Amino acids involved in the hydrophobic contacts are indicated and shown in sticks.
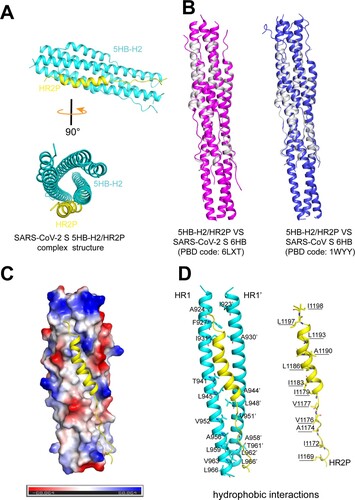
Figure 6. 5HB-H2 broadly neutralizes sarbecoviruses. (A) Phylogenetic tree of the sarbecoviruses S protein constructed via maximum likelihood analysis of amino acid sequences retrieved from GenBank. The HR2 sequences involved in 5HB-H2 interactions were completely conserved in sarbecoviruses, including SARS-CoV-2, RaTG13, PANG/GD, SARS-CoV, WIV1 and HKU3. (B) Binding avidity of 5HB-H2 protein to the S proteins of sarbecoviruses detected by flow cytometry. The ratio of stained cells was shown. (C) 5HB-H2 shows a broad-spectrum inhibitory activity against a variety of sarbecoviruses. Pseudoviruses were pre-incubated with 5HB-H2 at the indicated concentration and then were used to infect 293T-hACE2 cells. Inhibition of viral entry was measured according to the reduction in luciferase activities. Data are expressed as means ± SD. Error bars indicate standard deviation of triplicates.
Supplemental Material
Download MS Word (657.6 KB)Data availability
The coordinates and the related structural factors for 5HB-H2/HR2P complex have been deposited into the Protein Data Bank with a PDB code of 7Y9N.