
Figures & data
Figure 1. Overall scheme of the group design, immunization, and immunological characterization of female BALB/c mice. (a) Mice in 8 groups were immunized with ChAdTS-S via different immunization protocols. ChAd, Recombinant chimpanzee adenovirus vaccine ChAdTS-S; i.n., intranasal vaccination; i.m., intramuscular vaccination; (b) immunization and immunological characterization scheme. Dashes indicate no booster vaccination; indicates vaccination; indicates bleeding; indicates spleen lymphocyte isolation.
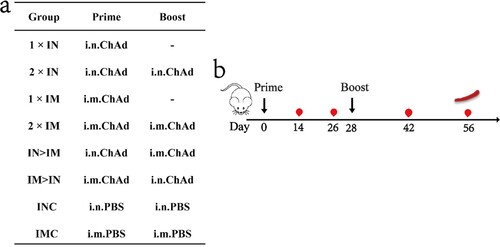
Figure 2. Humoral immune responses induced by ChAdTS-S vaccine using different vaccination protocols. All titres were measured at day 42 after prime immunization. (a) Serum spike-specific binding IgG titres (n = 5 per group, each spot represents one sample). (b) Serum spike RBD-specific binding IgG titres (n = 5 per group, one spot represents one sample). (c-e) Serum NAb titres against (c) Wuhan-Hu-1, (d) B.1.617.2, and (e) B.1.1.529. NAb titres are expressed as 50% inhibitory dilutions (n = 5 per group, one spot represents one sample). (f) Serum spike-specific IgA binding titres (n = 5 per group, each spot represents one sample). (g) Serum spike RBD-specific IgA binding titres (n = 5 per group, one spot represents one sample). Bars represent geometric means ± geometric SD; *P < 0.05; **P < 0.01; ***P < 0.001; ****P < 0.0001; ns: P > 0.05.
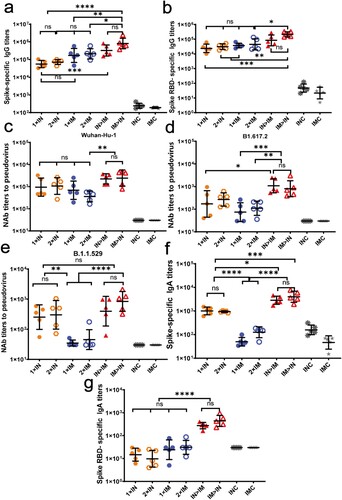
Figure 3. Serum NAb titre levels were assessed based on the Wuhan-Hu-1 strain SARS-CoV-2 pseudovirus. Serum samples were collected on days 14, 26, 42, and 56 after prime vaccination; NAb titres are expressed as 50% inhibitory dilutions (n = 5 per group, one spot represents GMT per group at each time point). Bars represent geometric means ± geometric SD; *P < 0.05; **P < 0.01; ***P < 0.001; ****P < 0.0001; ns: P > 0.05.
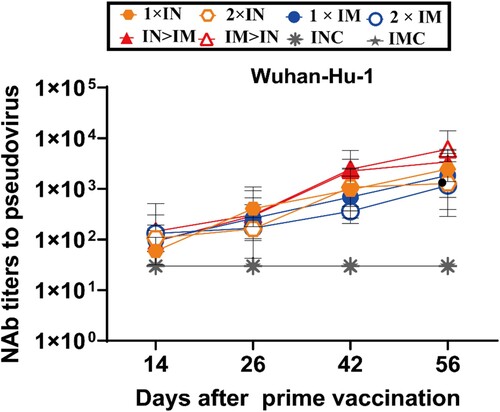
Figure 4. SARS-CoV-2 spike protein-specific cellular immune responses following ChAdTS-S vaccination. SARS-CoV-2 spike-specific IFN-γ detected using enzyme-linked immunospot assays. Five mice from each group were euthanized and their T-cell responses were measured. Lymphocytes were stimulated with SARS-CoV-2 spike peptide pools spanning the entire spike protein. IFN-γ-secreting cells were quantified using an ELISPOT assay (n = 5 per group; each data point represents the mean number of spots from double wells for one sample). Bars represent geometric means ± geometric SD, *P < 0.05; **P < 0.01; ***P < 0.001; ****P < 0.0001; ns: P > 0.05.
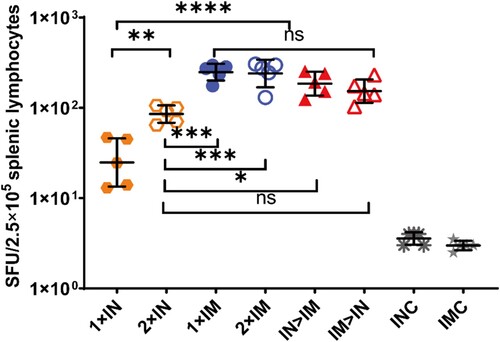
Figure 5. Th1/Th2 skewing detected by intracellular cytokine staining in ChAdTS-S immunized mice. Lymphocytes were stimulated with SARS-CoV-2 spike peptide pools spanning the entire spike protein for 8 h. Percentage of spike protein-specific IFN-γ, IL-2, TNF-α positive memory CD4+ T (a) and CD8+ T (b) cells, measured at day 56 after prime immunization (n = 5 per group, one spot represents one sample). Bars represent the geometric means ± geometric SD, *P < 0.05; **P < 0.01; ***P < 0.001; ****P < 0.0001; ns: P > 0.05.
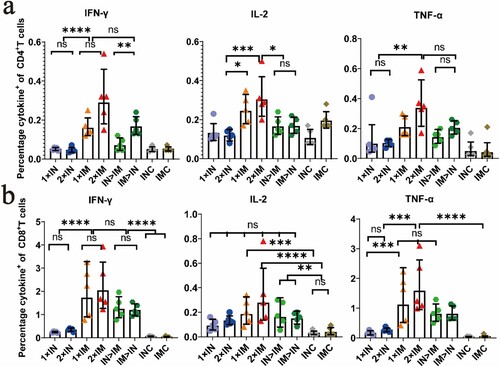
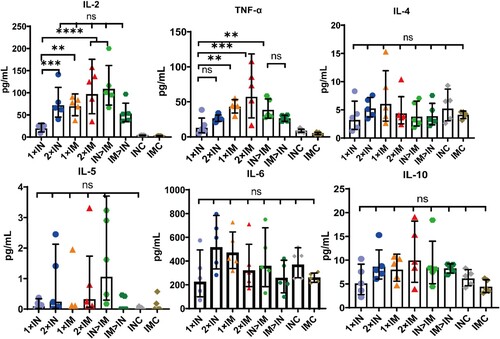
Figure 6. Th1/Th2 skewing in ChAdTS-S immunized mice measured using MSD cytokine profiling. Lymphocytes were stimulated with SARS-CoV-2 spike peptide pools spanning the entire spike protein for 24 h. IL-2, TNF-α, IL-4, IL-5, IL-6, and IL-10 levels in supernatants were measured (n = 5 per group, one spot represents one sample). Bars represent geometric means ± geometric SD, *P < 0.05; **P < 0.01; ***P < 0.001; ****P < 0.0001; ns: P > 0.05.
Supplemental Material
Download Zip (956.3 KB)Data availability
All data supporting this study are presented in the paper. The original datasets are also available from the corresponding author upon request.