Figures & data
Table 1. Characteristics of patients with fatal BoDV-1 encephalitis included in the study.
Figure 1. Cytokine, chemokine, growth factor and other biomarker changes in serum and cerebrospinal fluid of patients with BoDV-1 encephalitis. Serum (black) and CSF (grey) samples from ten BoDV-1 encephalitis patients and serum samples from ten healthy controls (hc) were analyzed in parallel for cytokines (panel A), chemokines (panel B), growth factors (panel C) and other biomarkers (panel D) by bead-based LEGENDplex assay. Results of two immunosuppressed patients are highlighted, patient 4 in red and patient 5 in blue. See for median measurements of patient biomarkers and healthy controls in serum (including p values and confidence intervals) and for median measurements of patient biomarkers (including confidence intervals) and reference values of biomarkers in CSF. Data are shown as median with interquartile range. β-NGF, beta-nerve growth factor; BDNF, brain-derived neurotrophic factor; CCL, CC-chemokine ligand; CXCL, C-X-C motif chemokine; G-CSF, granulocyte colony-stimulating factor; IFN, interferon; IL, interleukin; PDGF-BB, platelet-derived growth factor BB; sRAGE, soluble receptor for advanced glycation end products; sTREM, soluble triggering receptor expressed on myeloid cells; TGF, transforming growth factor; VEGF, vascular endothelial growth factor; VILIP, visinin-like protein.
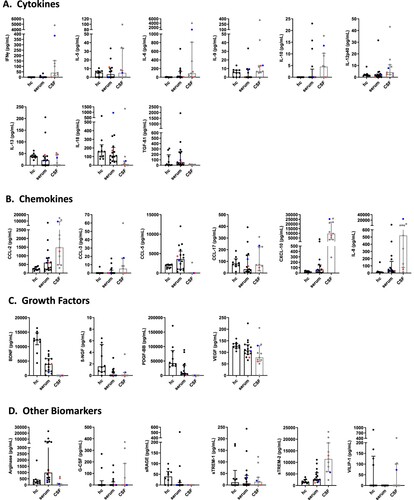
Table 2. Concentrations of cytokines, chemokines, growth factors and other biomarkers in sera of BoDV-1 encephalitis patients and healthy controls.
Table 3. Concentrations of cytokines, chemokines, growth factors and other biomarkers in CSF of BoDV-1 encephalitis patients and of controls from the literature.
Figure 2. Cytokine, chemokine, growth factor and other biomarker changes in serum and cerebrospinal fluid of patients with BoDV-1 encephalitis in two phases of illness. Serum (black) and CSF (grey) samples from ten BoDV-1 encephalitis patients and serum samples from ten healthy controls (hc) were analyzed in parallel for cytokines (panel A), chemokines (panel B), growth factors (panel C) and other biomarkers (panel D) by bead-based LEGENDplex assay. Results of two immunosuppressed patients are highlighted, patient 4 in red and patient 5 in blue. See for median measurements of patient biomarkers and healthy controls in serum (including p values and confidence intervals) and for median measurements of patient biomarkers (including confidence intervals) and reference values of biomarkers in CSF. For analysis, sampling dates of the patients were assigned to different phases of the illness after symptom onset. Therefore, the individual duration of illness in each patient was split in two equally long time periods (halves). Data are shown as median with interquartile range. β-NGF, beta-nerve growth factor; BDNF, brain-derived neurotrophic factor; CCL, CC-chemokine ligand; CXCL, C-X-C motif chemokine; G-CSF, granulocyte colony-stimulating factor; IFN, interferon; IL, interleukin; PDGF-BB, platelet-derived growth factor BB; sRAGE, soluble receptor for advanced glycation end products; sTREM, soluble triggering receptor expressed on myeloid cells; TGF, transforming growth factor; VEGF, vascular endothelial growth factor; VILIP, visinin-like protein.
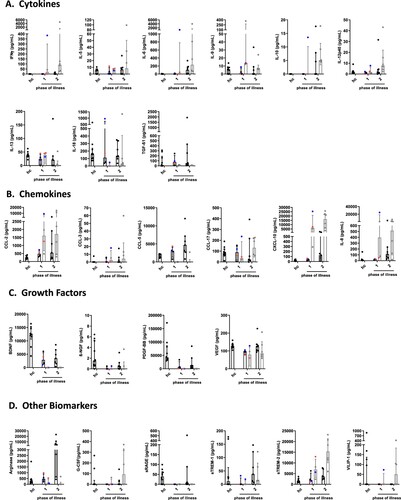
Figure 3. Expression of inflammatory and anti-inflammatory biomarkers in fixed brain tissue of patients with BoDV-1 encephalitis. Relative expression of biomarker gene mRNA was detected in FFPE brain tissue of three different brain regions from two patients. Relative expression is shown as fold change to reference sample. Colour gradient is presented as log10. Astrocyte and microglia pro-inflammatory/classical activation markers (A1/M1) showed an increased expression in patient 3, with strongest increase in pro-inflammatory IFNG, followed by IL6 and GFAP. Anti-inflammatory/regulatory activation state markers (A2/M2) TGFB1 and TIMP1 showed a slight increase, whereas no change was detected in FGF1 expression. In comparison to hippocampus and thalamus, basal ganglia demonstrated the strongest increase in gene expression in patient 3. Less data could be acquired from patient 11. Crossed-out squares label markers that were not detectable by qPCR. An increased GFAP expression, as well as decreased FGF1 expression, is similar to patient 3. In addition, BoDV-1 copy numbers are shown, demonstrating higher viral loads in patient 3 than in patient 11.
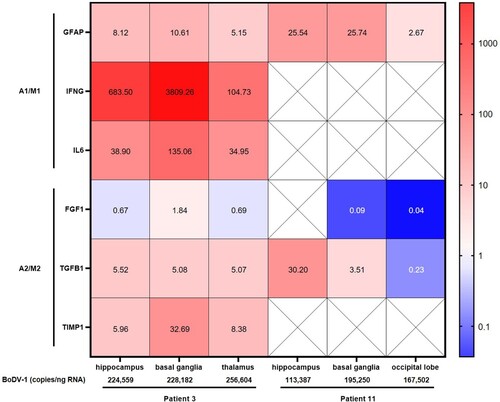
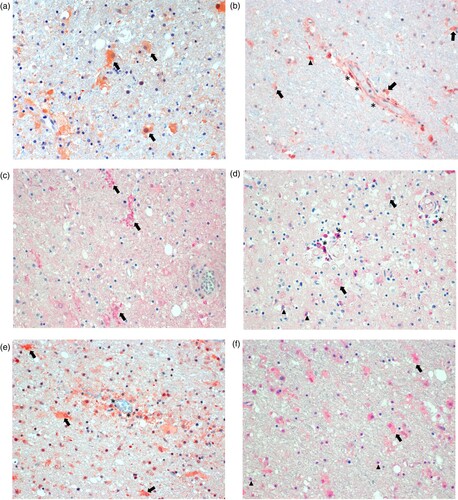
Figure 4. Immunohistology for molecularly detectable biomarkers in the brain of patients with BoDV-1 encephalitis. Panel A: Immunoperoxidase staining for glial fibrillary acidic protein (GFAP, 1:100; Zytomed Systems, Bargteheide, Germany; with citrate pretreatment), demonstrating activated, bizarre and enlarged astrocytes (arrows). Panel B: Immunoperoxidase staining for interferon-γ (IFNγ; 1:300; Abcam, Cambridge, UK; with citrate pretreatment), showing positivity in endothelial cells (asterisks), and most likely in microglia (arrowheads) and astrocytes (arrows) perivascularly. Panel C: Immunophosphatase staining for interleukin 6 (IL-6; Biosource-Thermo Fisher Scientific; with EDTA pretreatment), demonstrating ramified activated microglia (arrows). Panel D: Immunophosphatase staining for fibroblast growth factor-1 (FGF-1; LifeSpan BioSciences, Huissen, the Netherlands; with EDTA pretreatment), showing positivity in perivascular brain cells (asterisks), oligodendrocytes (arrowheads) and weakly in enlarged astrocytes (arrows). Panel E: Immunoperoxidase staining for transforming growth factor-β (TGF-β; DCS-diagnostics; with citrate pretreatment), demonstrating positivity in endothelial cells (asterisks) and mainly in activated astrocytes (arrows). Panel F: Immunophosphatase staining for tissue inhibitor of metalloproteinase 1 (TIMP1; Biosource-Thermo Fisher Scientific; with citrate pretreatment), showing positivity in activated and enlarged astrocytes (arrows) and in oligodendrocytes (arrowheads). All panels show basal ganglia sections with an original magnification of ×200. Symbols show a few examples of cell types only.