
Figures & data
Figure 1. Countries of origin of 513 phenotypic XDR isolates. Most were from South Africa (n = 181: 35.3%), Belarus (n = 57: 11.1%) and Pakistan (n = 42: 8.2%). There was no geographical data available for some isolates (n = 94: 18.3%).
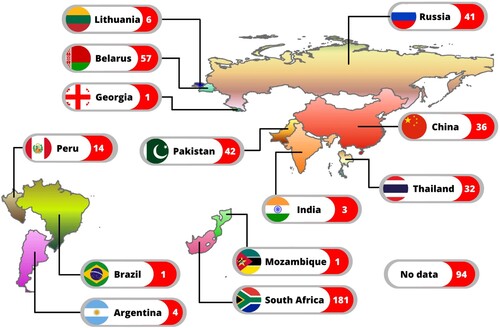
Table 1. Proportion of phenotypically XDR isolates (n = 513) with potential resistance-conferring mutations against six drugs.
Figure 2. Maximum-likelihood phylogenetic tree for 513 phenotypically XDR isolates. We used M. canettii as an outgroup. From inner to outer rings: drug-resistance mutations, country or origin, WGS-based genotypic drug-resistant profile (MDR-TB, pre-XDR-TB, and XDR-TB) and lineages. The genetic distance proportional to the total number of single nucleotide polymorphisms (SNPs) is indicated by the scale bar. TB, tuberculosis; MDR, multidrug resistance; XDR, extensively drug-resistance.
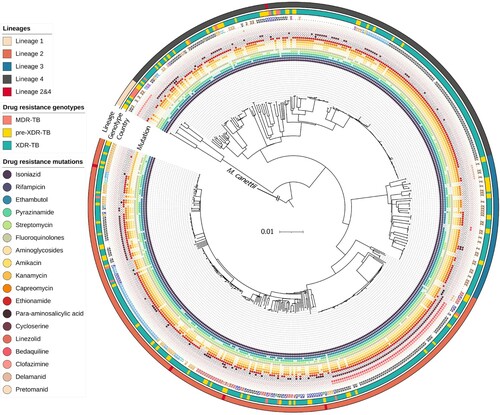
Figure 3. Geographical distribution of clustered drug-resistant isolates in this study. (A) The 99 clusters are labelled in alternating dark and light blue segments in the outer ring. The scale bar shows genetic distance proportional to the total number of SNPs. (B–J) 9 phylo-maps showing geographic links of each cluster to its country of origin.
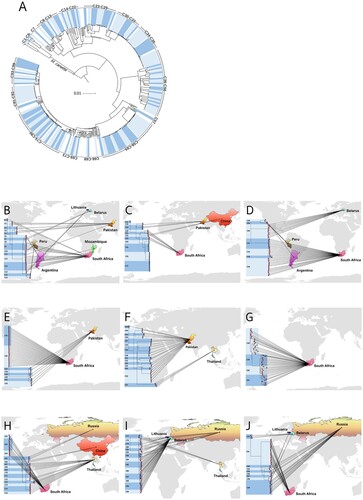
Table 2. Classification of primary versus acquired resistance of 408 phenotypic XDR-TB isolates among 99 clusters.