Figures & data
Figure 1. The prevalence of hv-CRKP and CR-hvKp strains. Distribution of carbapenemases is depicted as below. Intensity of box shading indicates the proportion of genomes harbouring different carbapenemases (orange), as per inset legend.
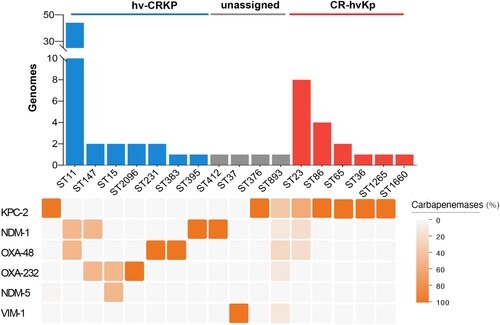
Figure 2. The mobilization of non-conjugative virulence plasmids by conjugative KPC plasmid. (A) Two rounds plasmid conjugation experiments simulating the transfer path of non-conjugative plasmid. (B) The confirmation of transconjugants by PFGE and S1-PFGE. *Virulence plasmid pK2044. #KPC plasmid pKPHS2. The same symbol is used to represent the parental strain and its transconjugant.
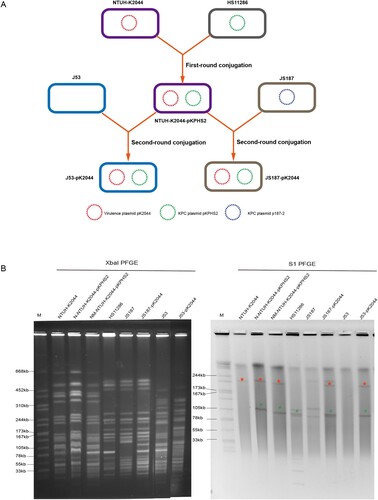
Figure 3. The transfer potential of mobilizable virulence plasmids. (A) The mobilization of mimic virulence plasmid by conjugative KPC plasmid pKPHS2. (B) The distribution of TraMpKPHS2-carrying plasmids in Enterobacteriaceae. (C) nic sites of pKPHS2 and pK2044. Alignment was generated with the MUSCLE sequence alignment tool.
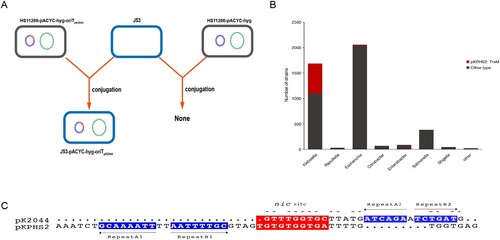
Table 1. Antimicrobial susceptibilities of strains and their transconjugants.
Figure 4. The virulence phenotypes and levels of CR-hvKp strain. (A) Mucoviscosity. (B) The relative expression of capsular synthesis genes. (C) Uronic acid. (D) Transmission electron microscopy of the capsule. (E) Biofilm formation. (F) Siderophores production. (G) Serum resistance. (H) The survival curves of infected Larvae wax. (I) The survival curves of infected mice. An unpaired two-sided Student’s t-test was performed for mucoviscosity, uronic acid, biofilm formation, siderophores production, and serum resistance. A log-rank (Mantel–Cox) test was performed for the survival curves. ***P< 0.001, **P< 0.01, *P< 0.05, ns: not significant.
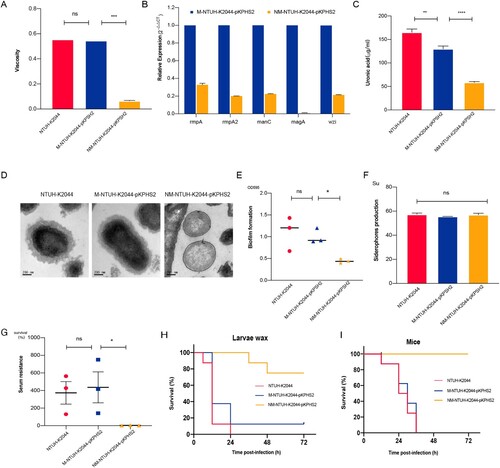
Figure 5. The influence of rfaH to carbapenem resistance and CPS production.
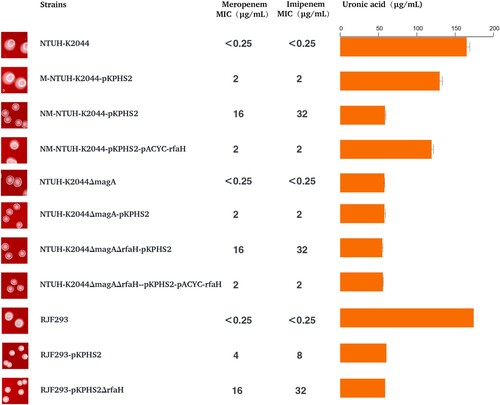
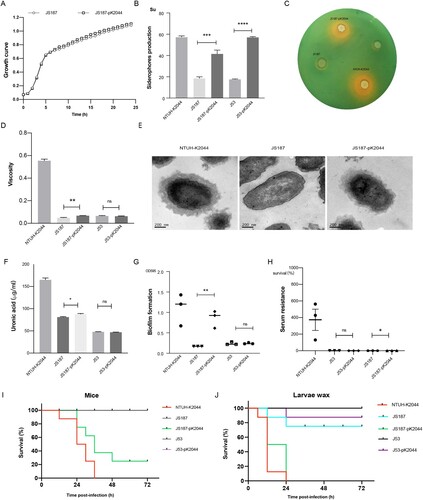
Figure 6. The virulence phenotypes and levels of hv-CRKP. (A) Growth curve. (B) Siderophores production quantification. (C) Siderophores production determined by CAS agar plate. (D) Mucoviscosity. (E) Transmission electron microscopy of the capsule. (F) Uronic acid. (G) Biofilm formation. (H) Serum resistance. (I) The survival curves of infected mice. (J) The survival curves of infected larvae wax. An unpaired two-sided Student’s t-test was performed for mucoviscosity, uronic acid, biofilm formation, siderophores production, and serum resistance. A log-rank (Mantel–Cox) test was performed for the survival curves. ****P < 0.0001, ***P< 0.001, **P< 0.01, *P< 0.05, ns: not significant.