Figures & data
Table 1. Primers used in this study.
Figure 1. Phylogenetic analysis and characteristics of the 48 MCR-ECC isolates collected in this study. A core-genome phylogenetic tree including the 48 MCR-ECC isolates was constructed and mid-point rooted. The isolates clustered into four clades corresponding to four species (blue: E. hormaechei, yellow: E. kobei, green: E. roggenkampii, purple: E. mori). The ST of each isolate is shown, and the novel ST is indicated by a dash. The absence (in pink) or presence (in red) of colistin and carbapenem resistance genes is diaplayed by a heatmap, and a truncated mutant of mcr-9 was marked with an asterisk. Clinical information of the isolates and patients are listed. The sterile-site specimens were in bold.
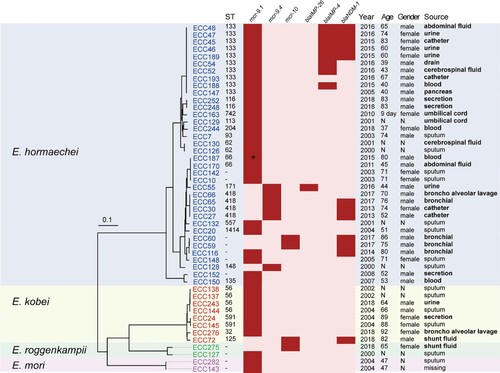
Table 2. Susceptibility profiles and MICs for 48 MCR-ECC strains.
Figure 2. Comparative genomic analysis on eight complete sequenced mcr-9-harboring MCR-CRE isolates. (A) Core-genome phylogenetic tree accompanied by a similarity matrix of mcr-9 plasmids. The isolates are coloured according to the STs (blue: ST133; red: ST418; green: a novel ST). The pairwise similarity between plasmids is shown by a heatmap, and is defined as the coverage of homology regions for query plasmid (row-wise) and subject plasmid (column-wise). (B) Synteny analysis of eight circularized mcr-9 plasmids. Identical regions (i.e. 100% similarity) are highlighted by grey rectangles. Arrows with direction indicate the sense of transcription of genes. Δ represents truncated genes.
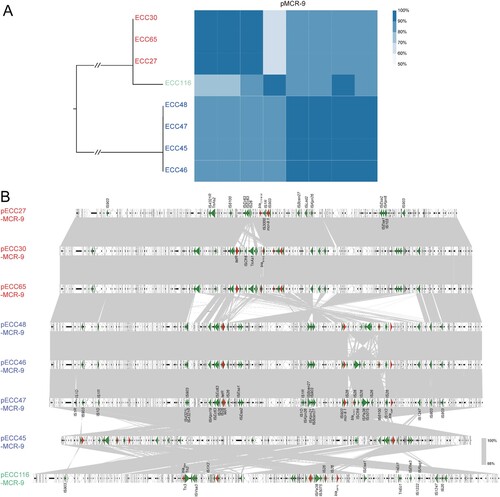
Figure 3. Detection of pECC116-MCR-9, pECC47-MCR-9, and pECC65-MCR-9 in 44 mcr-9-carrying MCR-ECC. The percentage length of virulence plasmid sequences are obtained by mapping short reads of the 44 isolates to the three mcr-9 plasmids (pECC116-MCR-9, pECC47-MCR-9, and pECC65-MCR-9) used as references. The existence of plasmid is defined by that isolates having short reads mapped to ≥90% of the reference plasmid length. The isolates are clustered according to coverages using the Pearson method. STs of isolates are indicated, and NA represents the novel ST.
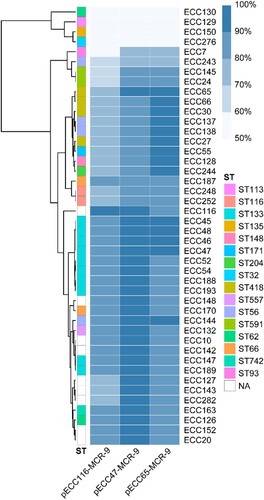
Figure 4. Pairwise comparison of blaNDM-1-carrying plasmids. Twelve blaNDM-1-carrying plasmids are included in the analysis, of which 11 are circularized, and the other one (Genome of ECC189) is analyzed using the draft genome. The similarity between sequences is defined as the coverage of homology regions for query plasmid (row-wise) and subject sequences (column-wise).
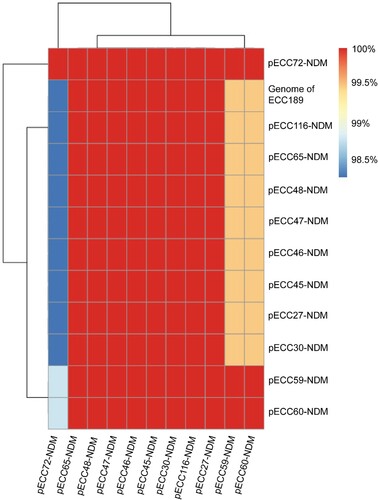
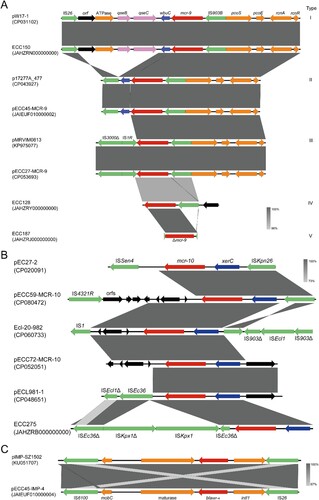
Figure 5. Synteny analysis for genetic environments of (A) mcr-9, (B) mcr-10, and (C) blaIMP-4. Identical regions are highlighted by dark grey rectangles (i.e. 100% similarity). Arrows with direction indicate the sense of transcription of genes, and Δ represents truncated sequences.