
Figures & data
Figure 1. Preferential V Gene Segments Usage of BCR in SARS-CoV-2 Infection and Vaccination. (A) Schematic overview of the 10X Genomics single-cell V(D)J sequencing process. The global BCR repertoire characterization in different nature of SARS-CoV-2 exposure. (B)The distribution of the top 5 paired heavy and light chains in SARS-CoV-2-infected (Inf.Grp.), healthy (Hlty.Grp.), vaccinated healthy (Vac.Hlty.Grp.), vaccinated recovered (Vac.Rec.Grp.) and unvaccinated recovered groups (Unvac. Rec.Grp.). (C) Sankey diagram shows total BCR-specific heavy and light VJ pairs that occurred more than once. (D–G) The frequency and differential analysis of VH gene segments between healthy and infected groups (D), healthy and vaccinated healthy groups (E), vaccinated healthy and infected groups (F), unvaccinated recovered and vaccinated recovered groups (G). The colours represent the p-value of the significant positive or negative. Red: p < 0.05, grey: p > 0.05. Fisher’s exact test, p-value less than 0.05, was considered to be statistically significant. (H) The polar plot shows the relative changes of VH genes usage in SARS-CoV-2-infected (Inf.Grp), vaccinated1st.15d healthy (Vac1st.15d.Hlty.Grp.) vaccinated1st.28d healthy (Vac1st.28d.Hlty.Grp.), vaccinated2nd.28d healthy (Vac2nd.28d.Hlty.Grp.)and vaccinated3rd.28d healthy(Vac3rd.28d.Hlty.Grp.) groups. The VH gene usage proportion of the healthy group (Hlty.Grp.) was considered as the baseline. The relative changes in VH gene usage were calculated by the following method: the proportion of VH gene at a certain time point minus above the baseline. (I) The polar plot shows the relative changes of VH genes usage in vaccinated1st.0d recovered (Vac1st.0d.Rec.Grp.), vaccinated1st.15d recovered (Vac1st.15d.Rec.Grp.), vaccinated1st.28d recovered (Vac1st.28d.Rec.Grp.) and unvaccinated recovered (Unvac.Rec.Grp.) groups. The calculation method of relative changes in VH genes usage was the same as in (H).
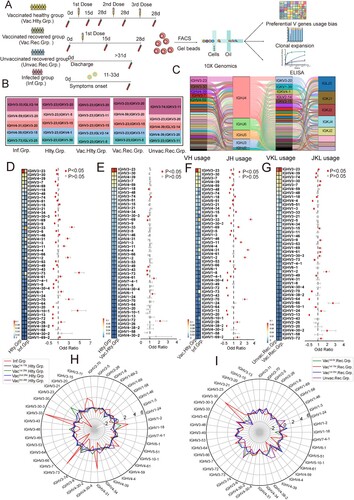
Figure 2. Immunoglobulin Isotypes Signature Analysis of SARS-CoV-2 Infection and Vaccination. (A) The bar graph shows immunoglobulin isotype distribution in Total, SARS-CoV-2 infected, vaccinated healthy, vaccinated recovered, unvaccinated recovered and healthy groups. (B) The bar graph shows immunoglobulin isotype distribution in SARS-CoV-2 infected, healthy, vaccinated1st.15d healthy, vaccinated1st.28d healthy, vaccinated2nd.28d healthy, vaccinated3rd.28d healthy, vaccinated1st.0d recovered, vaccinated1st.15d recovered, vaccinated1st.28d recovered and unvaccinated recovered groups. (C–E) The frequency and differential analysis of immunoglobulin isotypes between vaccinated healthy and infected groups(C), vaccinated healthy and unvaccinated recovered groups(D) and healthy and vaccinated healthy groups(E). The colours represent the p-value of the significant positive or negative, red: p < 0.05, grey: p > 0.05. Fisher’s exact test, p-value less than 0.05 was considered to be statistically significant. (F) Combination of V genes of heavy chain and light chain. The combination of V genes of heavy chain and light chain of IgA and IgG in infected vaccinated healthy and vaccinated recovered groups.
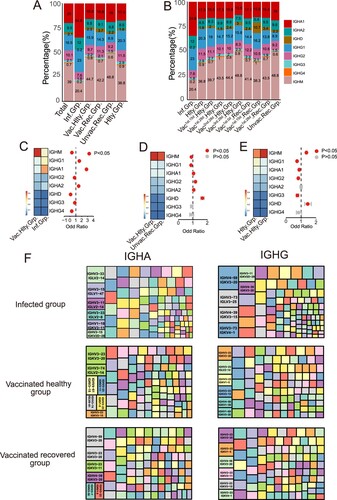
Figure 3. BCR Clonal Expansion Following SARS-CoV-2 Infection and Vaccination. (A) The Bar plot shows clonal expansion distribution in SARS-CoV-2 infected, healthy, vaccinated1st.15d healthy, vaccinated1st.28d healthy, vaccinated2nd.28d healthy, vaccinated3rd.28d healthy, vaccinated1st.0d recovered, vaccinated1st.15d recovered, vaccinated1st.28d recovered and unvaccinated recovered groups. The different colours represent the clone size. (B) The Bar plot shows the clonal expansion distribution in each sample. (C) The Bar plot shows clonal expansion distribution in different immunoglobulin isotypes, including IgM, IgA1, IgA2, IgG1, IgG2, IgG3, IgG4 and IgD. (D) The Bar plot shows the clonal expansion distribution of different immunoglobulin isotypes in different groups. (E) Binding of top1 dominant antibody to SARS-CoV-2 S2 antigen by ELISA.
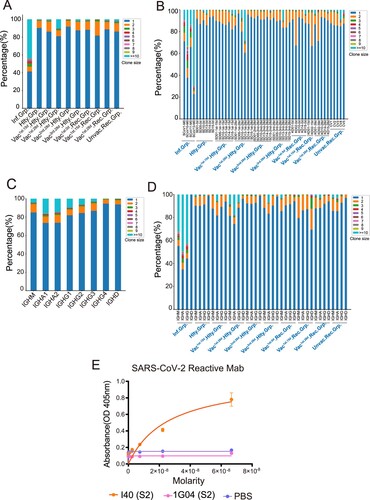
Figure 4. Characteristics of Somatic Hypermutation in Different Groups, Immunoglobulin isotypes and V genes. (A) The differential analysis of SHM rate in SARS-CoV-2 infected vaccinated healthy, vaccinated recovered, unvaccinated recovered and healthy groups. Statistical significance was evaluated using the Wilcoxon rank-sum test. Significance was defined as: *p-value < 0.05; **p-value < 0.01; ***p-value < 0.001 and **** p-value < 0.0001; not significant (ns): p-value > 0.05. (B) The differential analysis of SHM rate in SARS-CoV-2 infected, healthy, vaccinated1st.15d healthy, vaccinated1st.28d healthy, vaccinated2nd.28d healthy, vaccinated3rd.28d healthy, vaccinated1st.0d recovered, vaccinated1st.15d recovered, vaccinated1st.28d recovered and unvaccinated recovered groups. Statistical significance was evaluated using the Wilcoxon rank-sum test. (C) The differential analysis of SHM rate in IgM, IgA, IgG and IgD. (D) The differential analysis of SHM rate in IgM, IgA1, IgA2, IgG1, IgG2, IgG3, IgG4 and IgD. (E) SHM rate of immunoglobulin isotypes subclass in the different groups. (F–H) SHM rate of immunoglobulin isotypes subclass in the heavy chain (F), kappa chain(G) and lambda chain (H). The 10 most common IGHVs/IGKVs/IGLVs are ordered by frequency in the patients.
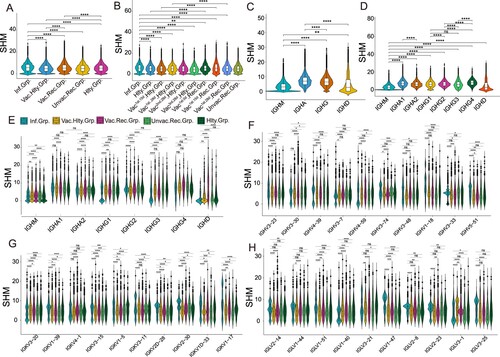
Figure 5. Convergent Paired Heavy and Light Sequences Shared between SARS-CoV-2 Infection and Vaccination. (A) The network diagram of clonotype cluster among in SARS-CoV-2 infected, healthy, vaccinated1st.15d healthy, vaccinated1st.28d healthy, vaccinated2nd.28d healthy, vaccinated3rd.28d healthy, vaccinated1st.0d recovered, vaccinated1st.15d recovered, vaccinated1st.28d recovered and unvaccinated recovered groups. Only the nodes ≥10 clonotype clusters are shown in this figure. (B–E) Convergent paired heavy and light clusters among different groups (the top panel). The sample distribution is indicated by the lines and dots with the number of clusters sharing that group distribution indicated by the vertical histogram bars. The total number of convergent clusters identified in each group is indicated in the histogram to the left of the plot. (F) Binding of convergent antibodies to SARS-CoV-2 spike antigen by ELISA. Public antibody I47 was found among the infected, vaccinated recovered and vaccinated healthy subjects, I90 and I91 in the infected subjects, and I93 in the vaccinated healthy and vaccinated recovered subjects.
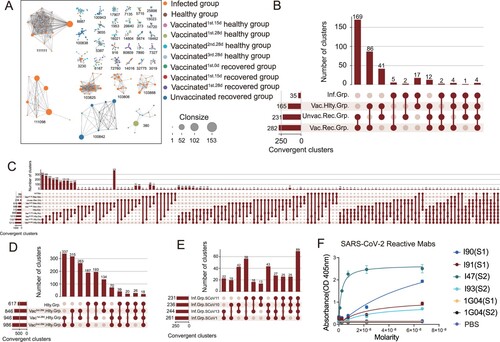
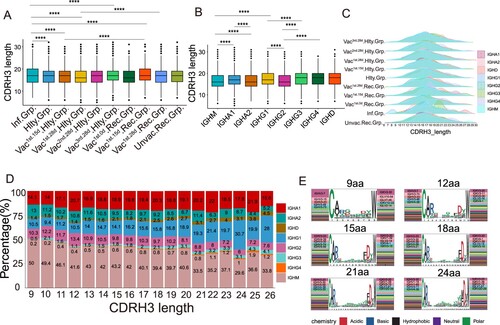
Figure 6. Characteristics of CDRH3 in SARS-CoV-2 Infection and Vaccination. (A) The differential analysis of CDRH3 length in SARS-CoV-2 infected, healthy, vaccinated1st.15d healthy, vaccinated1st.28d healthy, vaccinated2nd.28d healthy, vaccinated3rd.28d healthy, vaccinated1st.0d recovered, vaccinated1st.15d recovered, vaccinated1st.28d recovered and unvaccinated recovered groups. Statistical significance was evaluated using the two-sided t-test. Significance was defined as: *p-value < 0.05; **p-value < 0.01; ***p-value < 0.001 and **** p-value < 0.0001; not significant (ns): p-value > 0.05. (B) The differential analysis of CDRH3 length in IgM, IgA1, IgA2, IgG1, IgG2, IgG3, IgG4 and IgD. Statistical significance was evaluated using the two-sided t-test. (C) Distribution of CDR3 length of each group in different immunoglobulin isotypes. (D) The Bar plot shows the proportion of immunoglobulin isotypes in different CDRH3 lengths, including IgM, IgA1, IgA2, IgG1, IgG2, IgG3, IgG4 and IgD. (E) The heavy and light genes usage, and CDR3 motif of clonal BCR which CDR3 length is 9aa, 12aa, 15aa, 18aa, 21aa and 24aa.
Supplemental Material
Download MS Word (39.1 KB)Data availability statement
The raw sequencing data have been deposited into the Genome Sequence Archive of National Genomics Data Center (CNCB), under accession code HRA002583 at https://ngdc.cncb.ac.cn/gsa-human/. The authors declare that the code used for the current study is available from the lead contact (Prof. Yao-Qing Chen, [email protected]) upon request.