Figures & data
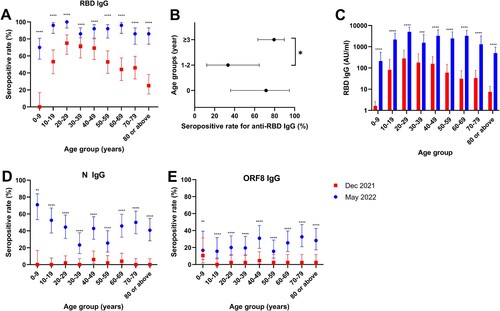
Figure 1. Serosurveillance of the Hong Kong population in December 2021 and May 2022. (A) Age-specific anti-RBD IgG seropositive rates. Data represent the seropositive rate, and the error bar represents the 95% confidence interval. (B) Comparison of seropositive rates among <1, 1–2 and 3–9 year-old individuals in May 2022. Data represent the seropositive rate, and the error bar represents the 95% confidence interval. (C) Age-specific anti-RBD IgG levels in December 2021 and May 2022. Data represent geometric mean and error bar represents the 95% confidence interval. (D&E) Age-specific anti-N (D) and anti-ORF8 (E) IgG seropositive rates. Data represent the seropositive rate, and the error bar represents the 95% confidence interval. *P < 0.05; **P < 0.01; ***P < 0.001; ****P < 0.0001.