
Figures & data
Table 1. Prevalence of 13 virulence genes in four clonal complexes and two macrolide susceptibility Moraxella catarrhalis groups.
Figure 1. Comparison of functional annotations in the macrolide-resistant and macrolide-susceptible Moraxella catarrhalis groups.
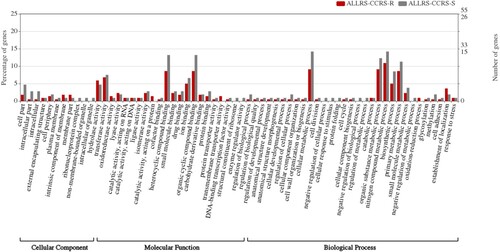
Figure 2. Comparison of virulence gene prevalence between four clonal complexes and between macrolide-resistant and macrolide-susceptible Moraxella catarrhalis groups. Macrolide-resistant and macrolide-susceptible M. catarrhalis isolates are shown in red and blue fonts, respectively. Grey and blank bars represent the presence and absence of genes, respectively.
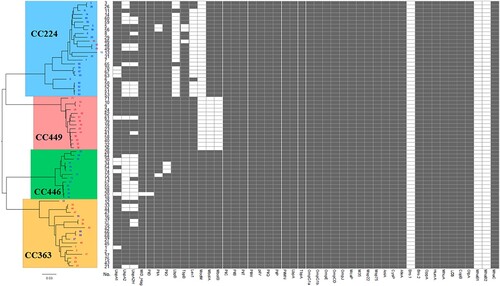
Figure 3. Comparison of adhesion and invasion abilities of 19 Moraxella catarrhalis isolates with different virulence gene combinations. R, macrolide-resistant; S, macrolide-susceptible. (A) The distribution of different virulence genes between four clonal complexes and between macrolide-resistant and macrolide-susceptible M. catarrhalis groups and its relevance to bacterial adhesion and invasion. Grey and blank bars represent the presence and absence of genes, respectively. (B and D) Comparison of M. catarrhalis adhesion and invasion abilities between the macrolide-resistant and macrolide-susceptible groups and (C and E) between four clonal complexes. The levels of cytokines and bacterial growth between the macrolide-susceptible and macrolide-resistant groups were analysed using the two-tailed Mann-Whitney test, while those between the four clonal complexes were analysed using one-way analysis of variance. Differences were considered significant at P < 0.05.
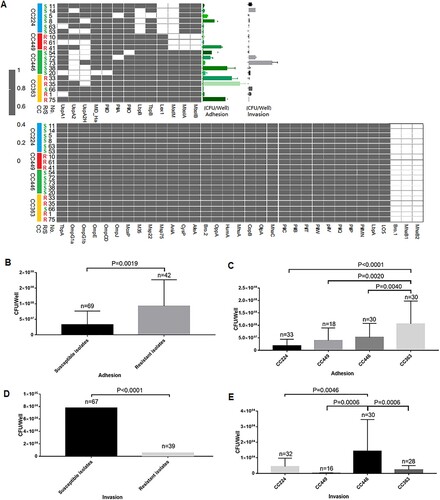
Figure 4. Transmission electron microscopy analysis of the ability of Moraxella catarrhalis to adhere and invade A549 cells. The distribution of M. catarrhalis 35-OR (resistant isolate) (A) and M. catarrhalis 73-OR (susceptible isolate) (B) outside and inside A549 cells at 4 h post-infection (magnification: ×3000). (C) Lamellipodia enclosing M. catarrhalis 73-OR (susceptible isolate) at 4 h post-infection and different phases of macropinocytotic ingestion (magnification: ×15000). M. catarrhalis isolates are shown using arrows. Scale bars: 5 (A and B) or 1 µm (C).
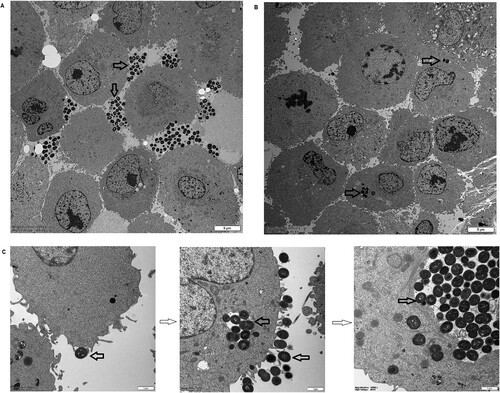
Figure 5. Histological changes in the haematoxylin and eosin-stained pulmonary tissue at 3 h post-infection (magnification: ×100 and ×400). Pulmonary inflammation in mice (n = 5–7 per group) challenged with phosphate-buffered saline (PBS), 108 colony-forming units (CFU) of Moraxella catarrhalis 73-OR, and 108 CFU of M. catarrhalis 35-OR. Representative lung tissue sections are shown. Pulmonary sections of control (C3) (magnification: ×100 (A) and ×400 (D)), mice (S3) challenged with 108 CFU of M. catarrhalis 73-OR (susceptible isolate) (magnification: ×100 (B) and ×400 (E)), and mice (R1) challenged with 108 CFU of M. catarrhalis 35-OR (resistant isolate) at 3 h post-infection (magnification: ×100 (C) and ×400 (F)).
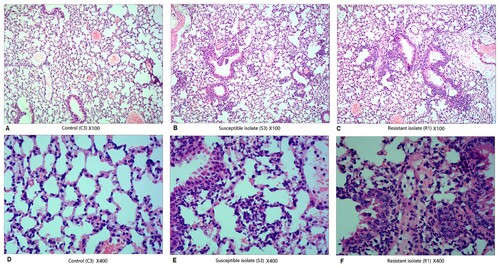
Figure 6. Bacterial counts in the lung tissue and white blood cell (WBC) counts and cytokine levels in the blood after Moraxella catarrhalis infection. Pulmonary clearance and systemic inflammatory changes in mice (n = 5–7 per group) challenged with phosphate-buffered saline (PBS), 108 CFU of M. catarrhalis 73-OR, or 108 CFU of M. catarrhalis 35-OR. (A) The bacterial counts in the 73-OR-infected and 35-OR-infected groups at 3 h post-infection were significantly (P < 0.0001) lower than that at 0 h post-infection. The clearance of susceptible isolate (73-OR) was significantly rapid when compared with that of resistant isolate (35-OR) (P = 0.0134). (B) At 3 h post-infection, the WBC counts in the 73-OR-infected and 35-OR-infected groups were lower than those in the control group. In particular, the WBC counts significantly decreased in the 35-OR-infected group (P = 0.0393). (C) At 3 h post-infection, the blood Il6, Il10, Il27, and Tnf levels in the 73-OR-infected and 35-OR-infected groups were significantly (P < 0.05) higher than those in the control group, especially in the 73-OR-infected group. Pulmonary clearance and WBC counts in the control, macrolide-susceptible, and macrolide-resistant groups were compared using one-way analysis of variance. Differences were considered significant at P < 0.05.
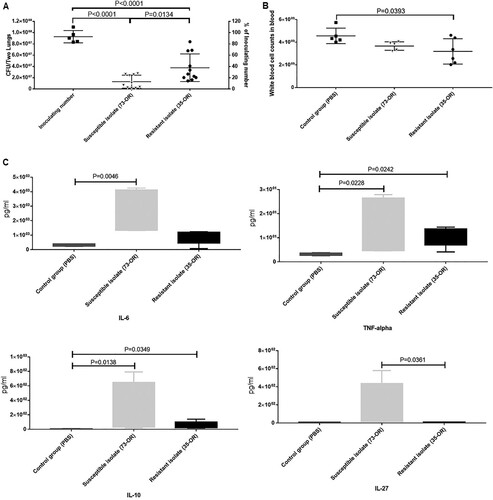
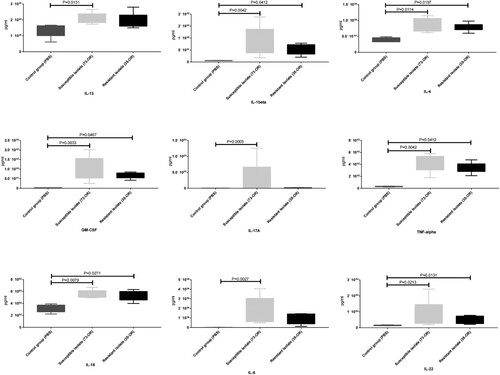
Figure 7. Pulmonary levels of cytokines in Moraxella catarrhalis-infected mice. Pulmonary inflammation in mice (n = 5–7/group) challenged with phosphate-buffered saline (PBS), 108 colony-forming units (CFU) of M. catarrhalis 73-OR, and 108 CFU of M. catarrhalis 35-OR. At 3 h post-infection, the Il13, Il1b, Il4, Il6, Il17a, Il18, Il22, Tnf, and Csf2 levels in the 73-OR-infected and 35-OR-infected groups were significantly (P < 0.05) higher than those in the control group, especially in the 73-OR-infected group.
Supplemental Material
Download MS Excel (37.6 KB)Data availability statement
The raw Illumina sequencing reads have been deposited in the Sequencing Read Archive database (https://www.ncbi.nlm.nih.gov/sra) (accession numbers: SRX2447596–SRX2447599, and SRX2161439, SRX2161445, SRX2161448, and SRX2161449).