
Figures & data
Figure 1. Preparation of the target protein. (A) Strategies for the construction of NTD, RBD, and S2 protein. (B) Identification of target fragments. Lane 1, DNA Marker. Lane 2–4, Amplicons of the NTD gene. Lane 5 and 9, Blank lane. Lane 6–8, Amplicons of the RBD gene. Lane 10–12, Amplicons of the S2 gene. (C) SDS-PAGE for the identification of the expression and purification of the proteins NTD, RBD, and S2. Lane 1, Protein Marker. Lane 2, NTD cell supernatant. Lane 3, NTD cell precipitate. Lane 4, NTD-purified. Lane 5, RBD cell supernatant. Lane 6, RBD cell precipitate. Lane 7, RBD-purified. Lane 8, S2 cell supernatant. Lane 9, S2 cell precipitate. Lane 10, S2-purified. (D) Western Blot for the identification of the proteins NTD, RBD, and S2 with HRP-Conjugated 6*His-Tag mAbs. Lane 1, Protein Marker. Lane 2, NTD purified. Lane 3, RBD purified. Lane 4, S2 purified. Lane 5, the blank vector pcDNA3.1.
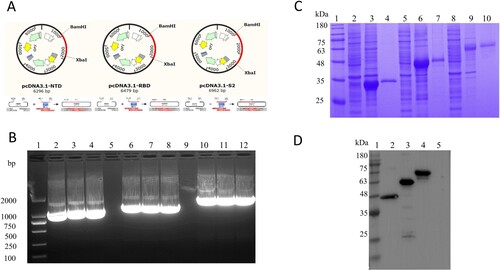
Figure 2. Identification of mAbs prepared in this study. (A) Ascites titers of monoclonal antibodies performed by the indirect ELISA. (B) The subtype of monoclonal antibodies. (C) The IFA assay was used to analyze the reactivity between mAbs screened and NTD, RBD, and S2 proteins. The green colour is the reaction of anti-NTD, RBD, and S2 mAbs with corresponding proteins. The blue colour is the nucleus of the HEK293T cells. The negative control is the untransfected cells incubated with the eyeball blood (positive serum). The positive control is transfected pcDNA3.1-NTD, pcDNA3.1-RBD, and pcDNA3.1-S2 cells that are incubated with the eyeball blood. (D) Western blot was used to perform the reactivity between proteins (NTD, RBD, and S2) and mAbs (prepared in this study).
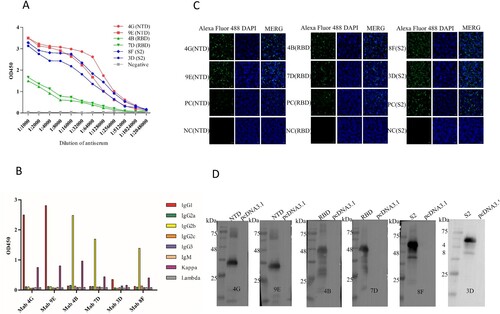
Table 1. Characteristics of mAbs.
Figure 3. Framework for the design of epitope screened (#1–#12 were the peptide pool designs).
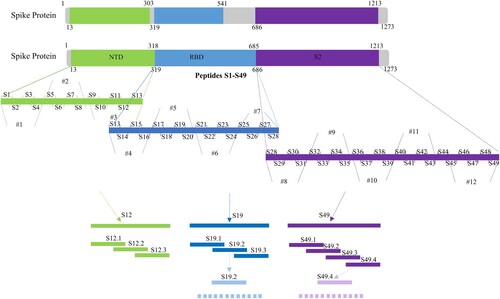
Figure 4. Map of the linear epitope. Negative Control (NC): BSA. (A) The peptide pools spanning the extracellular region of the S protein were screened by the indirect ELISA and dot immunoblotting. (Distribution of peptide pools was as in Table S3). (B) The peptides S9–S13, S17–S20, and S44–S49 were performed to react with the mAbs (4G, 9E, 4B, 7D, 8F, and 3D) by the indirect ELISA and dot immunoblotting. (C) Map of the truncated sequence of peptides S12, S19, and S49 by the indirect ELISA and dot immunoblotting.
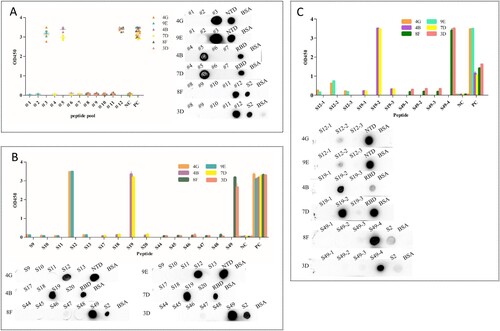
Figure 5. Alanine scanning mutation was used to identify the key amino acid sites in mAbs binding. (A) The binding ability of mutation sequences of peptide S19.2 to mAbs 4B and 7D. (B) The binding ability of mutation sequences of peptide S49.4 to mAbs 8F and 3D.
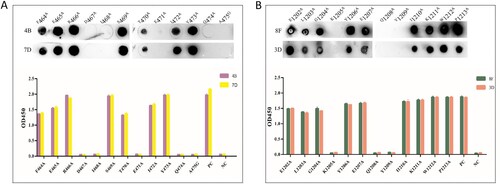
Table 2. Alanine-scanning mutagenesis of peptides S19.2 and S49.4.
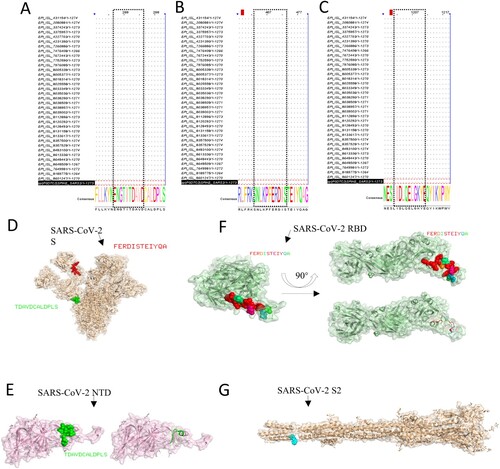
Figure 6. Bioinformatics analysis of epitopes. The epitopes were performed to multiple sequence alignments with the sequence of partial VOC and VOI strains. (A) S12.2 286TDAVDCALDPLS297, (B) S19.2 464FERDISTEIYQA475, (C) S49.4 1202ELGKYEQYIKWP1213). The spatial structure of epitopes was screened in this research. (D) The epitope 286TDAVDCALDPLS297 (Green colour) and epitope 464FERDISTEIYQA475 (red colour) are shown on the S protein (PBD: 7CWU). (E) The characteristics of epitope 286TDAVDCALDPLS297 (Green colour) on the spatial structure of the NTD protein (PBD: 7B62). (F) The characteristics of the epitope 464FERDISTEIYQA475 on the spatial structure of the RBD protein (PBD: 6W41). (G) The partial region (blue colour) of the epitope 1202ELGKYEQYIKWP1213 is shown on the spatial structure of the S2 protein (PBD: 7E9T).
Supplemental Material
Download MS Word (105.9 KB)Data availability statement
The data that support for the findings of this study are all contained in the manuscript and supplementary materials.