Figures & data
Table 1. The basic characteristics of enrolled patients.
Figure 1. The proportion of viral shedding time ≤9 days and >9 days according to clinical diagnosis, vaccination, and paxlovid use. (a) The proportion of viral shedding time ≤9 days and >9 days according to clinical diagnosis. (b) The proportion of viral shedding time ≤9 days and >9 days according to paxlovid use. (c) The proportion of viral shedding time ≤9 days and >9 days according to vaccination.
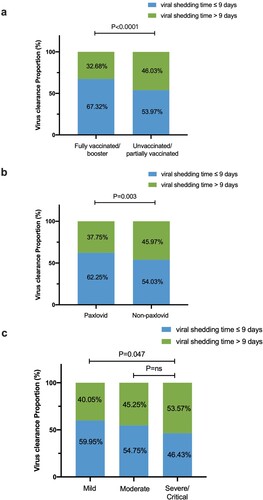
Table 2. Influencing factors of viral shedding time among geriatric patients.
Table 3. Risk factors of progressing to severe/critical (n = 61) among geriatric patients.
Table 4. Risk factors of progressing to severe/critical among geriatric patients using comorbidity numbers.
Figure 2. The severe/critical rate according to comorbidity numbers, vaccination, and age. (a) The severe/critical rate in patients with comorbidities ≤1 and comorbidities ≥2. (b) The severe/critical rate in patients in different age groups with different vaccination doses.
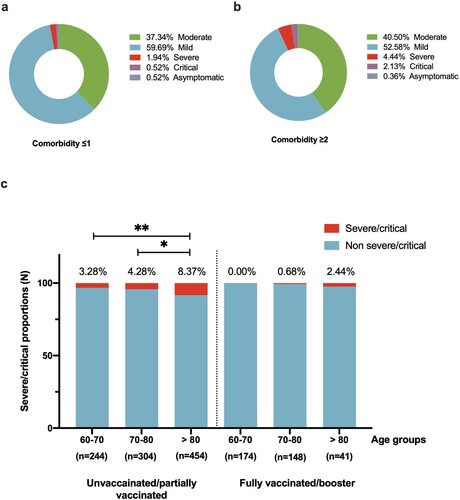
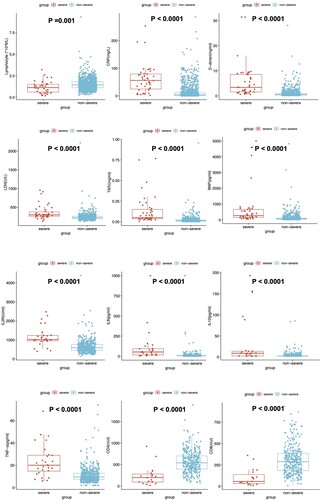
Figure 3. Laboratory markers of severe/critical patients. The indicators include lymphocyte numbers, CRP, BNP, LDH, D-dimer, and cytokines (IL2R, IL6, IL8, IL10, TNF-α) and numbers of CD4+ and CD8+ cells.
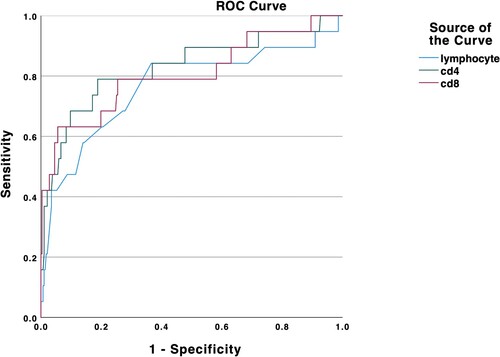
Figure 4. ROC curve of lymphocyte, CD4, and CD8 in distinguishing severe/critical.