
Figures & data
Table 1. Average results in accuracy terms by repeating 20 times a 10-fold cross validation analysis 20 times for all ML supervised algorithms for each method and step.
Figure 1. Distance plot of RF and PLS-DA for discrimination between ESRI developers susceptible to P/T and their isogenic isolates resistant to P/T. A. C, Full Spectrum method. B. D, Threshold method. ESRI: Extended spectrum resistance to BL/BLI susceptible to P/T; Pressed: ESRI isogenic isolates resistant to P/T after pressure with P/T; PLS-DA: partial least squares discriminant analysis; RF: random forest. t0 and t1 are two components of an algorithm called MDS that help to represent data from a distance matrix.
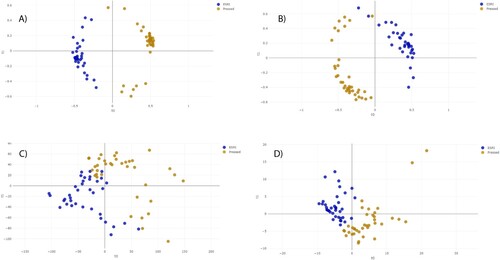
Figure 2. Distance plot of RF and PLS-DA for discrimination between P/T-susceptible and P/T-resistant E. coli (first step analysis). A. C, Full Spectrum method. B. D, Threshold method. PLS-DA: Partial Least Square Discriminant Analysis; RF: Random Forest. t0 and t1 are two components of an algorithm called MDS that help to represent data from a distance matrix.
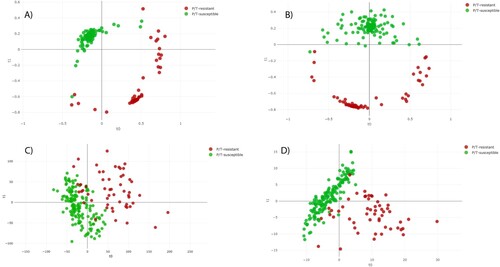
Figure 3. Distance plot of RF and PLS-DA for discrimination between P/T-susceptible and ESRI developer Escherichia coli (second step analysis). A. C, Full Spectrum method. B. D, Threshold method. PLS-DA: Partial Least Square Discriminant Analysis; RF: Random Forest. t0 and t1 are two components of an algorithm called MDS that help to represent data from a distance matrix.
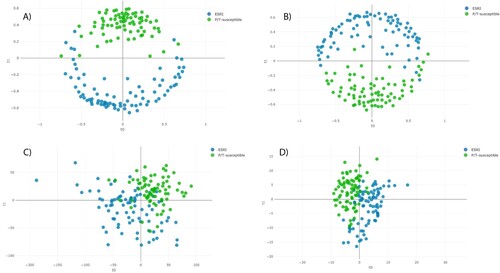
Figure 4. Feature importance from RF analysis from each assay. A, ESRI developers susceptible to P/T and their isogenic isolates resistant to P/T. B, P/T-susceptible and P/T-resistant E. coli (Step 1). C, P/T-susceptible and ESRI developers susceptible to P/T (Step 2). RF: Random Forest; ESRI: Extended Spectrum Resistance to BL/BLI susceptible to P/T.
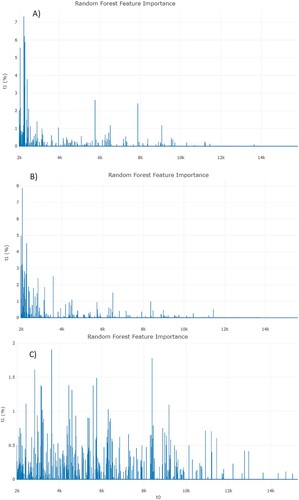
Figure 5. Average ROC curves from first 10-folds and their AUC values obtained from RF using Full Spectrum method to discriminate between A, ESRI developers susceptible to P/T and their isogenic isolates resistant to P/T B, P/T-susceptible and P/T-resistant E. coli and C, P/T-susceptible and ESRI developer Escherichia coli. Isogenic isolates resistant to P/T, resistant isolates to P/T and ESRI developer isolates susceptible to P/T were labelled as positive categories respectively.
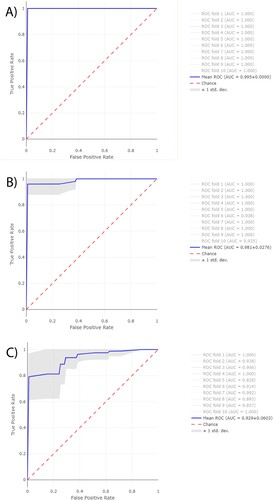
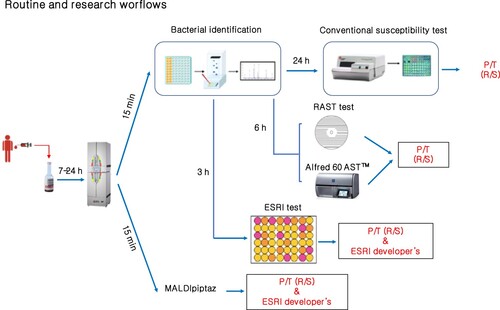
Figure 6. Routine and research workflows for rapid determination piperacillin/tazobactam resistance and ESRI developers by E. coli. P/T: piperacillin/tazobactam; R: Resistance; S: susceptible.
Supplemental Material
Download MS Word (30.4 KB)Data availability statement
The data that support the findings of this study are available from the corresponding author upon reasonable request.