Figures & data
Table 1. Demographics and clinical characteristics of tegumentary leishmaniasis patients.
Figure 1 . Synthetic neoglycoproteins used in this study. (A) Schematic representation of type-2 GIPLs 1-3 of L. major. The terminal glycan moiety (G29, G30, or G28) targeted for chemical synthesis in each GIPL is indicated. Galp, galactopyranose; Galf, galactofuranose; Man, mannopyranose; GlcN, glucosamine; myo-Ins, myo-inositol; P, phosphate; PI, phosphatidylinositol. (B) Schematic representation of the synthesis of NGP29b containing the type-2 GIPL-1 terminal, nonreducing glycotope Galfβ1,3Manα. TCEP-HCl, Tris (2-carboxyethyl) phosphine hydrochloride; linker, 4-(succinimidomethyl)cyclohexane-1-carboxy group. The same conjugation was used for the synthesis of NGP30b and NGP28b [Citation24]. (C) Representative MALDI-TOF-MS spectrum of NGP29b to confirm the covalent conjugation of the glycan units to the carrier protein, as recently described [Citation32]. The same quality-control procedure was used for NGP30b and NGP28b, as previously described [Citation24]. Doubly charged ([BSA+2H]+2 and [NGP29b+2H]+2) and singly charged ([BSA + H]+, [NGP29b + H]+, and [BSA2 + H]+) ions of BSA and NGP29b are indicated. The number of glycan units (n = 30) covalently attached to the BSA moiety is indicated. m/z, mass to charge ratio. (D) Composition of the synthetic NGP29b, NGP30b, and NGP28b. For simplicity, the glycan thiopropyl group (at the reducing end), the linker covalently attached to the lysine residue, and the number of glycan units shown in B, are not indicated.
![Figure 1 . Synthetic neoglycoproteins used in this study. (A) Schematic representation of type-2 GIPLs 1-3 of L. major. The terminal glycan moiety (G29, G30, or G28) targeted for chemical synthesis in each GIPL is indicated. Galp, galactopyranose; Galf, galactofuranose; Man, mannopyranose; GlcN, glucosamine; myo-Ins, myo-inositol; P, phosphate; PI, phosphatidylinositol. (B) Schematic representation of the synthesis of NGP29b containing the type-2 GIPL-1 terminal, nonreducing glycotope Galfβ1,3Manα. TCEP-HCl, Tris (2-carboxyethyl) phosphine hydrochloride; linker, 4-(succinimidomethyl)cyclohexane-1-carboxy group. The same conjugation was used for the synthesis of NGP30b and NGP28b [Citation24]. (C) Representative MALDI-TOF-MS spectrum of NGP29b to confirm the covalent conjugation of the glycan units to the carrier protein, as recently described [Citation32]. The same quality-control procedure was used for NGP30b and NGP28b, as previously described [Citation24]. Doubly charged ([BSA+2H]+2 and [NGP29b+2H]+2) and singly charged ([BSA + H]+, [NGP29b + H]+, and [BSA2 + H]+) ions of BSA and NGP29b are indicated. The number of glycan units (n = 30) covalently attached to the BSA moiety is indicated. m/z, mass to charge ratio. (D) Composition of the synthetic NGP29b, NGP30b, and NGP28b. For simplicity, the glycan thiopropyl group (at the reducing end), the linker covalently attached to the lysine residue, and the number of glycan units shown in B, are not indicated.](/cms/asset/ea62dfb4-f806-46e2-b713-49d19159304c/temi_a_2114852_f0001_oc.jpg)
Figure 2. Cross-titration of NGPs with serum pools from CL, Chagas disease, and nonendemic controls. cELISA tests were performed with NGP29b, NGP28b, or NGP30b at concentrations ranging from 50 to 3.13 ng/well, using a pool of sera (n = 15) from patients with active CL, caused by L. braziliensis. Pools of sera obtained from patients with chronic Chagas disease (CD) (n = 15), and from nonendemic healthy controls (NEC) (n = 15) were also evaluated. Each point represents the mean of duplicate values of the relative luminescence units (RLU) obtained for each sample and bars indicate SD. Statistical analysis: two-way Anova with main effects only and Dunnett’s multiple comparison test (with individual variances computed for each comparison). The CL and CD curve were compared with the NEC curve, at 1:400 and 1:800 serum pool dilution. *p < 0.05, **p < 0.01,****p < 0.0001; statistically non-significant differences are not shown.
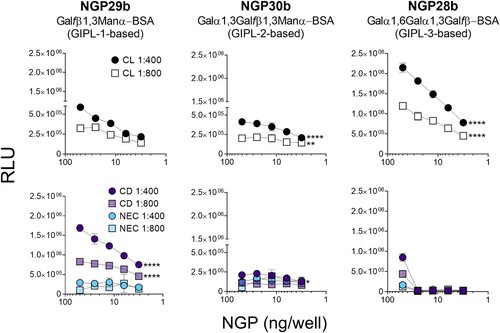
Figure 3. Normalized IgG response of sera from patients with tegumentary leishmaniasis (TL) to L. major type-2 GIPL-1-derived NGP29b and GIPL-3-derived NGP28b. cELISA immunoassays were performed using NGPs at 5 ng/well and serum samples (1:800 dilution) from all TL samples (n = 80), with different clinical forms (CL; n = 17; ML n = 16; DL, n = 16; and SC, n = 31) plotted separately; Chagas disease (CD, n = 16); and all non-TL, seemingly healthy controls (NEC + EC; n = 33), also plotted separately (EC, n = 15; and NEC, n = 18). Each point represents the mean of triplicate relative luminescence units (RLU) values normalized to NEC serum pools. The cutoff value (cELISA titer = 1.000), calculated as described in Materials and Methods, is indicated by the continuous green line. Data are represented as violin plots (truncated) of individual points, with median (thick black line) and interquartile range (dotted black lines) values indicated. *p < 0.05, **p < 0.01, ****p < 0.0001, Kruskal Wallis followed by Dunn’s multiple comparison tests. Statistically non-significant differences between serum groups are not shown.
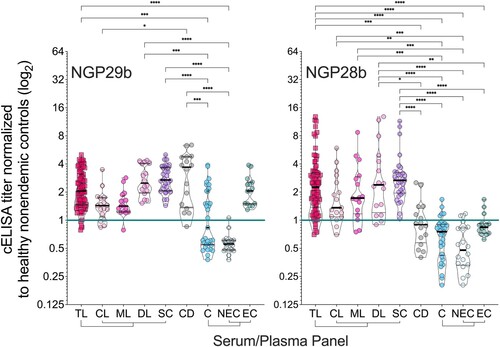
Table 2. Sensitivity, specificity, and other diagnostic parameters of type-2 GIPL-1-based NGP29b, in the comparison of different TL clinical forms vs. endemic and nonendemic controls.
Table 3. Sensitivity, specificity, and other diagnostic parameters of type-2 GIPL-3-based NGP28b, in the comparison of different TL clinical forms vs. endemic and nonendemic controls.
Figure 4. Receiver-operating characteristic (ROC) curves for NGP29b and NGP28b comparing the reactivity of sera from total TL patients or CL, ML, DL, SC, or CD patients versus control sera from endemic (EC) and nonendemic (NEC) individuals, using cELISA titers normalized to NECs. The area under the curve (AUC) is indicated in the gray area, and 95% confidence interval (CI) values are indicated in parentheses.
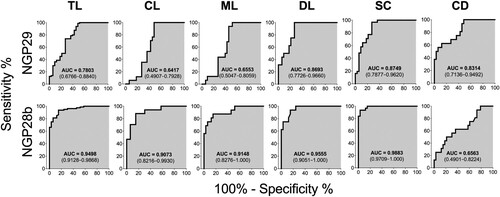
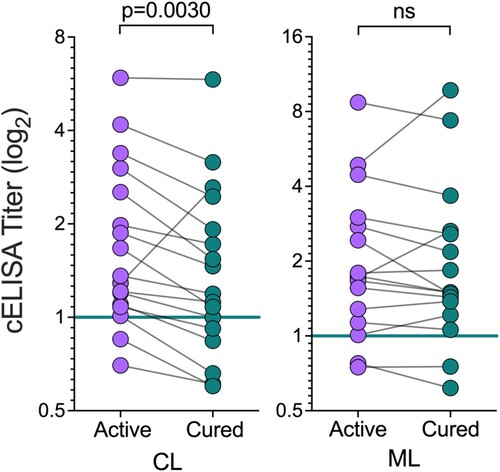
Figure 5. Seroreactivity to NGP28b of TL patients, before and after treatment. Sera from CL (n = 17) or ML (n = 16) patients, obtained before and 90 days after standard Sbv treatment, were probed by cELISA with NGP28b (5 ng/well). Each point represents the mean of triplicate RLU values normalized to a pool of sera from seemingly healthy NEC individuals. p Values were calculated using Wilcoxon matched-pairs test. Significance level: p < 0.05.