Figures & data
Figure 1. Identification of NS3. NS transcripts were amplified by RT–PCR from cells infected with RG-AIV-WT virus (A). The identity of an unexpected transcript (indicated by arrowhead) was revealed by automated sequencing. Alignment analysis indicated that the additional transcript, denoted as NS3, was a spliced version of NS1. NS3 contained sequences corresponding to NS1 with a deletion between the splicing dinucleotides 374GU-AG502. The expression of NS1 isoforms from NS1031 was validated (B–C). The expression profiles and cellular distributions of proteins expressed from wild-type NS1031 (WT), a construct with a substitution of splicing donor site (T375G), and the NS3 construct (deletion of NS1 residues 375-502) in transiently transfected cells were examined by western blot analysis (B) and fluorescence microscopy (C).
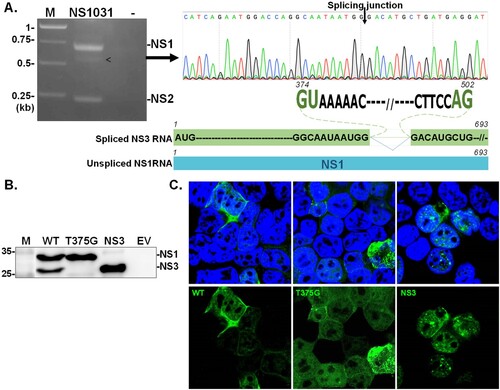
Figure 2. Growth kinetics of reassortant viruses expressing various isoforms of NS1031. Recombinant AIVs bearing the NS segments derived from NS1031. Constructs were made for expressing wild-type NS1 (WT), only full-length NS1 (T375G), or NS3 (NS1 with internal deletion). Infection with these three reassortant viruses produced plaques of similar sizes (A) and the expected NS1 profile (B) in MDCK cells. Growth kinetics of the three reassortant viruses in four cell lines: human A549, canine MDCK, mouse M1 cells, and chicken DF1 cells. The titres of viral progenies were measured from the four cell lines (infected with 0.01 MOI of the indicated virus) after 12, 24, 36 and 48 h. The viral yields of each variant were plotted relative to wild-type virus (C).
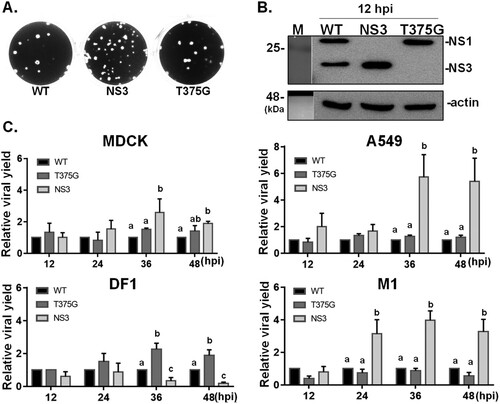
Figure 3. Expression levels of NS1 variants in infected mammalian and avian cells. Levels of accumulated viral proteins, including NP, NS1 and NS3, in mammalian (A549, and M1) and avian DF1 cells were determined by immunoblot analysis after infection with the indicated viruses for 6 and 12 h (A). The level of viral protein expressed by RG-AIV-WT was arbitrary set as 1, and the relative expression levels of viral proteins were plotted for different viruses at 12 hpi (B). The ratio of NS3/NS1 protein (C) and RNA (D) were determined from different cell types infected by indicated viruses. *p < 0.05.
Figure 4. Impacts of NS1 variants on viral genome activity. (A) The effect of NS1 isoforms on viral RNA dependent RNA polymerase (RdRp) activity was evaluated by mini-genome reporter assay. HEK293T cells were co-transfected with one of the NS1 plasmids (PR8, WT NS1031, NS3 or T375G) along with constructs expressing the viral RdRp complex (PA, PB1, PB2 and NP proteins); the RdRp complex expression construct was based on either PR8 (A), or NS1031 virus (B). In addition to these two plasmids, a reporter plasmid pPol I-Flu-Rluc and internal control plasmid expressing firefly luciferase were also transfected. At 24 h post-transfection, luciferase activities (top panel) and NS1 expression (bottom panel) of the whole cell lysate were respectively measured with the Dual-Glo luciferase assay and western blot analysis. The Renilla luciferase expression level was initially normalized with firefly luciferase activity in the same group. Then, the relative expression level was obtained by comparison with the EV control, which was arbitrarily set as 1. The experiment was conducted in triplicate. *p < 0.05.
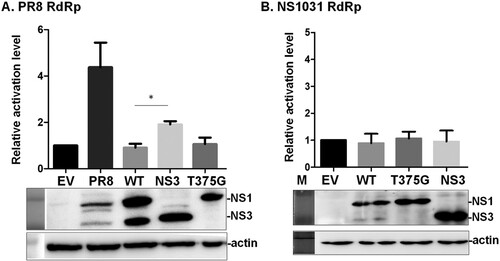
Figure 5. Effects of NS1 variants on protein kinase R (PKR) activation and interaction. NS1 modulates PKR activation. HEK293T cells were transfected with empty vector (EV), or plasmid expressing an NS1 protein variant (WT, T375G or NS3), followed by stimulation of PKR activation by the transfection of 150 ng/ml poly I:C for 4 hr. The phosphorylation level of PKR was monitored by Western blot analysis (A), and PKR activation level relative to EV was estimated and plotted (B). NS1 variants interact with PKR. HEK293T cells were transfected with plasmids expressing hemagglutinin (HA)-tagged PKR together with either EV or one of the constructs expressing an NS1 isoform. After transfection, FLAG-IP and immunoblotting were performed (C). The level of PKR-NS1 interaction relative to WT NS1031 was estimated and plotted (D). Replication efficiency of reassortant RG-AIVs in A549 cells deficient in PKR function was determined (E). Human A549 cells without (WT) or with knockout (KO) of PKR function were infected with reassortant RG-AIVs expressing WT NS1, NS3, or T375G for 12, 36 and 48 hpi. The titres of virus progenies were determined by the standard plaque assay. The titre of each virus in PKR-WT cells was set as 1, and the relative viral yields in infected PKR-KO cells were then calculated. All experiments were conducted in triplicate. *p < 0.05, **p < 0.01.
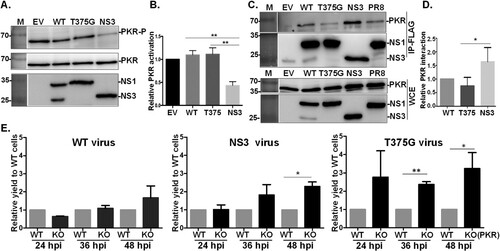
Figure 6. Expression profiles of cytokines in mammalian or avian cells infected with reassortant AIVs. Human A549 (A), murine M1(B), and chicken DF1 (C) cells were infected with reassortant AIVs at MOI of 0.1. Total RNA was extracted at 6 hpi. The expression levels of cytokines, including IFN-β, MX and TNF-α were detected by qRT–PCR. The expression level of each cytokine was initially normalized to that of mock infection. All experiments were conducted in triplicate. *p < 0.05 comparing the particular virus with others.
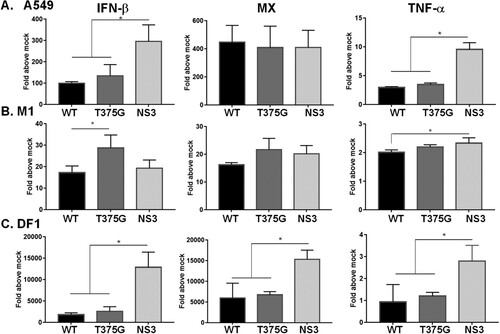
Figure 7. Expression profiles of cytokines and viral RNA in mice infected with reassortant AIVs. Mice (n = 5) were infected with reassortant AIVs, and blood were collected at 12 and 24 hpi. The expression levels of cytokines, including IFN-β and TNF-α were detected by qRT–PCR (A, C), or ELISA (B). Moreover, at 24 hpi, blood was collected and mice were sacrificed. IFN-β protein level in blood was detected by ELISA (B), and viral RNA (M gene) in lung tissue was measured (D). All experiments were conducted in triplicate. Significant differences between two groups are denoted by different letters.
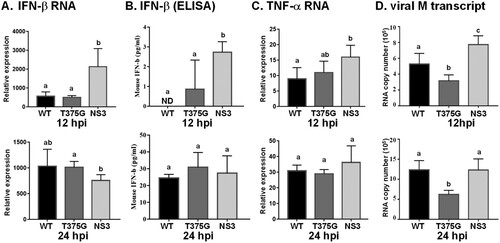
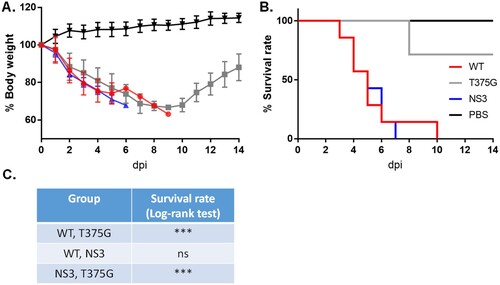
Figure 8. Survival rates of mice infected with reassortant AIVs. Mice (n = 7) were infected with reassortant AIVs. Infected (WT, NS3, or T375G virus) and control mice (PBS) were monitored for 14 days post-infection (dpi) for body weight loss (A) and survival rate (B and C). ***p < 0.005; ns, not significant (p > 0.05).