
Figures & data
Table 1. In vitro neutralization potency of CT-P63 against live viruses and pseudoviruses.
Figure 1. Prophylactic efficacy of CT-P63 against wild-type SARS-CoV-2 in an hACE2 transgenic mouse model. (A) Mean (SD) change in body weight. (B) Lung viral titres. (C) Nasal wash viral titres.
Notes: In panel A, a denotes p < 0.05 between placebo and CT-P63 1 mg/kg group and b denotes p < 0.05 between placebo and CT-P63 1 mg/kg and 10 mg/kg groups. In panels B and C, *, **, ***, and **** denote p < 0.05, p < 0.01, p < 0.001, and p < 0.0001 relative to placebo, respectively. hACE2, human angiotensin-converting enzyme 2; SARS-CoV-2, severe acute respiratory syndrome coronavirus 2; SD, standard deviation.
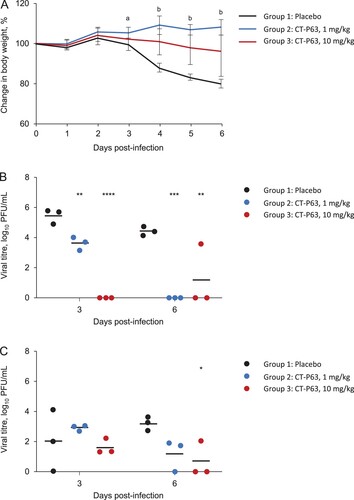
Figure 2. Efficacy of CT-P63 against SARS-CoV-2 Beta, Delta, and Omicron variants in an hACE2 transgenic mouse model. (A) Mean (SD) change in body weight after Beta variant infection. (B) Lung viral titres after Beta variant infection. (C) Nasal wash viral titres after Beta variant infection. (D) Mean (SD) change in body weight after Delta variant infection. (E) Lung viral titres after Delta variant infection. (F) Nasal wash viral titres after Delta variant infection. (G) Mean (SD) change in body weight after Omicron variant infection. (H) Lung viral titres after Omicron variant infection at Day 3 post-infection. (I) Nasal wash viral titres after Omicron variant infection at Day 3 post-infection.
Notes: In panel A, a denotes p < 0.001 between placebo and CT-P63 20 mg/kg group and p < 0.0001 between placebo and CT-P63 40 mg/kg group and b denotes p < 0.001 between placebo and CT-P63 20 mg/kg and 40 mg/kg groups. In panels B, C, D, E, F, G, H, and I *, **, ***, and **** denote p < 0.05, p < 0.01, p < 0.001, and p < 0.0001 relative to placebo, respectively.hACE2, human angiotensin-converting enzyme 2; SARS-CoV-2, severe acute respiratory syndrome coronavirus 2; SD, standard deviation.
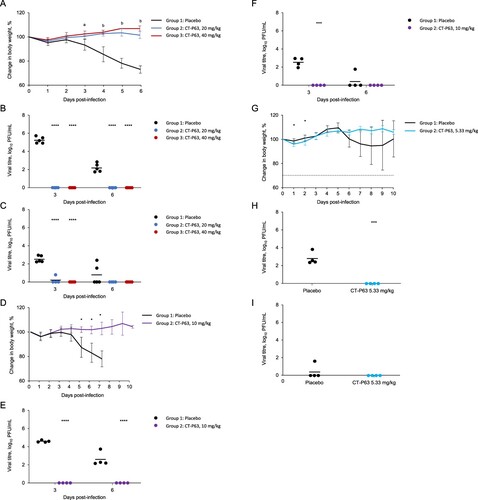
Figure 3. Participant flow diagram.
*Four back-up participants were included, in case enrolment was not met; these participants discontinued the study before randomization.
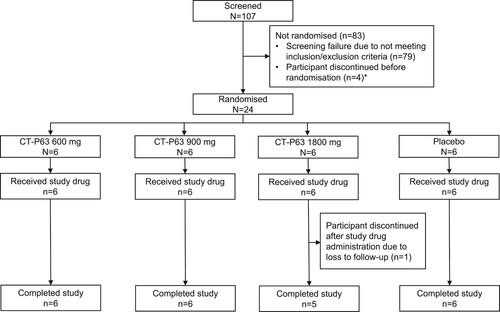
Table 2. Participant demographics and baseline characteristics (ITT Set).
Table 3. Summary of TEAEs (Safety Set).
Figure 4. Mean (SD) serum CT-P63 concentrations over time* (A) linear scale and (B) semi-logarithmic scale (PK Set).
*The lower limit of quantification was 1.00 µg/mL; concentrations below this were treated as 0. PK, pharmacokinetic; SD, standard deviation.
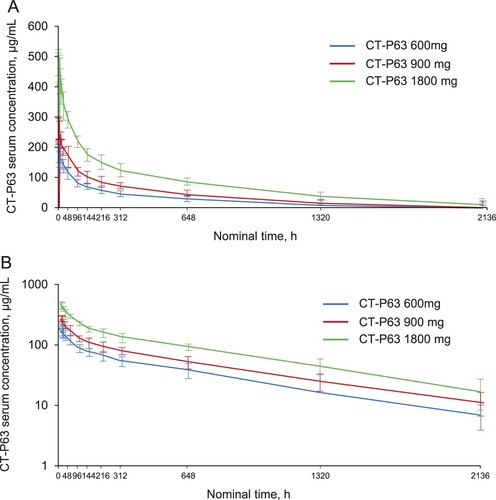
Table 4. Summary of serum PK parameters for CT-P63 (PK Set).
Supplemental Material
Download MS Word (829.8 KB)Data availability statement
The authors confirm that the data supporting the findings of this study are available within the article and its supplementary materials.