
Figures & data
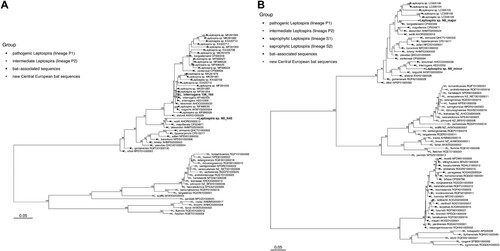
Figure 1. Phylogenetic relationships between Leptospira lipL32 sequences (A) and flaB sequences (B). Separate groups, including new sequences detected in Central European bats, are indicated by distinct symbols. The maximum likelihood trees were inferred using a TIM3+F+I+G4 model for lipL32 and a TVMe+I+G4 model for flaB in IQ-TREE v2.1.1. Numbers next to nodes indicate the percent bootstrap support after 1000 replicates. Branch lengths are in units of substitutions per site.
Supplemental material