
Figures & data
Figure 1. Omicron BA.1 is less dependent on TMPRSS2-mediated plasma membrane entry pathway and is highly dependent on the endosomal entry pathway for virus entry. (A) Amino-acid sequence alignment of residues around the S1/S2 cleavage site of SARS-CoV-2 reference strain WIV04, HKU001a, Delta, Omicron BA.1, S1/S2-10Del, and S1/S2-AAAA. Amino acid positions are designated based on SARS-CoV-2 reference strain. (B–C) Calu3 and VeroE6 cells were challenged with SARS-CoV-2 WT, Delta, Omicron BA.1, or S1/S2-10Del. Cell lysates were harvested at 24 hpi for quantification of the subgenomic RNA of the envelope (sgE) gene (n = 6). (D–G) Calu3 and VeroE6 cells were pre-treated with indicated concentrations of camostat or E64D for 2 h followed by the authentic SARS-CoV-2 variants infection. The amount of viral subgenomic envelope RNA in harvested cell lysates at 24 hpi was determined by qRT-PCR (n = 4 for 50uM of camostat and E64D groups, n = 6 for the other groups). Error bars were calculated by using log-transformed data and represented mean ± SD from the indicated number of biological repeats. Statistical significances were determined with one way-ANOVA. Data were obtained from three independent experiments. Each data point represents one biological repeat. * represented p < 0.05, ** represented p < 0.01, *** represented p < 0.001, and **** represented p < 0.0001. ns, not statistically significant; WT, wildtype SARS-CoV-2.
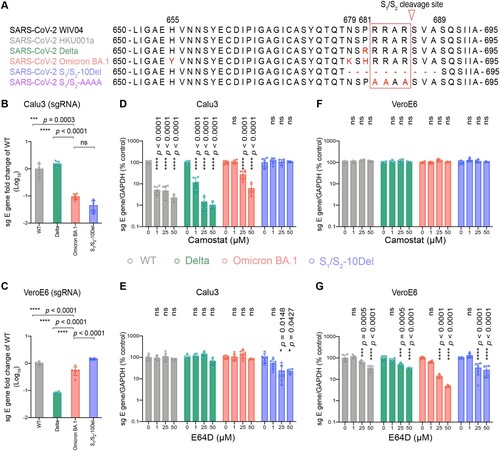
Figure 2. Spike determinants for the reduced TMPRSS2 usage of Omicron BA.1 and BA.2. (A) Schematic of all amino acid mutation sites on Omicron BA.1 and BA.2 spike when compared to ancestral SARS-CoV-2 spike. (B) 293T cells were transfected with hACE2 or co-transfected with hACE2 and TMPRSS2, followed by transduction with pseudoviruses bearing the spike of SARS-CoV-2 D614G, Omicron BA.1, Omicron BA.2, S1/S2-10Del, S1/S2-AAAA and individual mutation at 24 h post-transfection. Pseudovirus entry was quantified by measuring the luciferase signal (n = 4). Fold changes in the luciferase signal were normalized to the mean luciferase readouts of cells with only hACE2 overexpression. Data represent mean ± SD from the indicated number of biological repeats. Statistical significance was determined with one way-ANOVA. Data were obtained from three independent experiments. Each data point represents one biological repeat. * represented p < 0.05, ** represented p < 0.01, *** represented p < 0.001, and **** represented p < 0.0001. ns, not statistically significant.
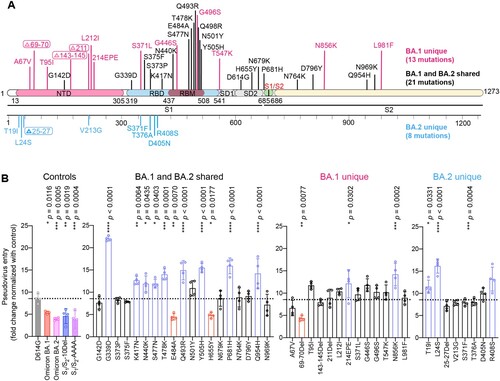
Figure 3. Spike determinants for the reduced spike cleavage of Omicron BA.1 and BA.2. (A) 293T cells were transfected with the indicated spike plasmids. Cell lysates were harvested at 24 h post-transfection for detection of SARS-CoV-2 spike cleavage using an anti-spike S2 antibody. Representative images of spike were shown with β-actin added as a sample processing control. Spike and β-actin were run on different gels and detected on different membranes. The experiment was repeated four times independently with similar results. (B) The cleavage ratio of different spikes from four times independent experiments was quantified by ImageJ. Data represent mean ± SD from the indicated number of biological repeats. Statistical significance was determined with one way-ANOVA. Data were obtained from four independent experiments. Each data point represents one biological repeat. * represented p < 0.05, ** represented p < 0.01, *** represented p < 0.001, and **** represented p < 0.0001. ns, not statistically significant.
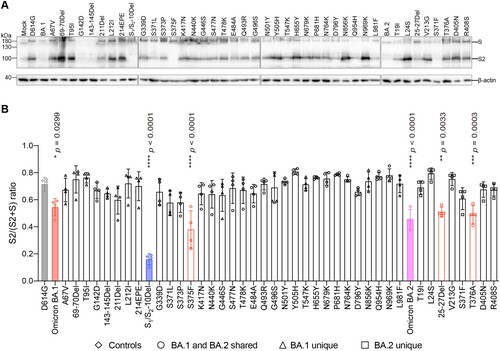
Figure 4. Determinants for the reduced spike-mediated cell–cell fusion of Omicron BA.1 and BA.2. (A) Representative images of spike-mediated cell–cell fusion. 293T cells (effectors cells) were co-transfected with the indicated spike with GFP1-10, and were co-cultured with 293T cells co-transfected with human ACE2 (hACE2), TMPRSS2, and GFP11 (target cells). The co-cultured cells were fixed with 10% formalin and stained with DAPI. Representative images were from four independent experiments with similar results. (B) The fusion area was normalized with the SARS-CoV-2-D614G spike-mediated cell–cell fusion group by ImageJ. Data represent mean ± SD from the indicated number of biological repeats. Statistical significance was determined with one way-ANOVA. Data were obtained from four independent experiments. Each data point represents one biological repeat. * represented p < 0.05, ** represented p < 0.01, *** represented p < 0.001, and **** represented p < 0.0001. ns, not statistically significant.
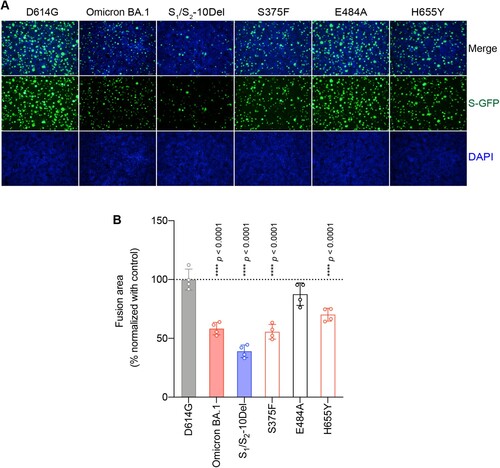
Figure 5. Spike determinants for the altered entry mechanism of Omicron BA.1 and BA.2. A-D. 293T cells were transfected with hACE2 or co-transfected with hACE2 and TMPRSS13 (A), TMPRSS11D (B), Cathepsin L (C), or Cathepsin B (D), followed by transduction with pseudoviruses expressing the indicated spike at 24 h post-transfection. Pseudovirus entry was quantified by measuring the luciferase signal (n = 4). Fold changes in the luciferase signal were normalized to the mean luciferase readouts of cells with only hACE2 overexpression. Data represent mean ± SD from the indicated number of biological repeats. Statistical significance was determined with one way-ANOVA. Data were obtained from three independent experiments. Each data point represents one biological repeat. * represented p < 0.05, ** represented p < 0.01, *** represented p < 0.001, and **** represented p < 0.0001. ns, not statistically significant.
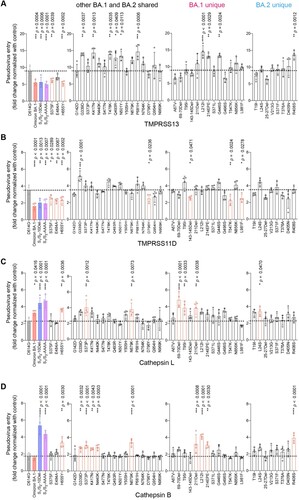
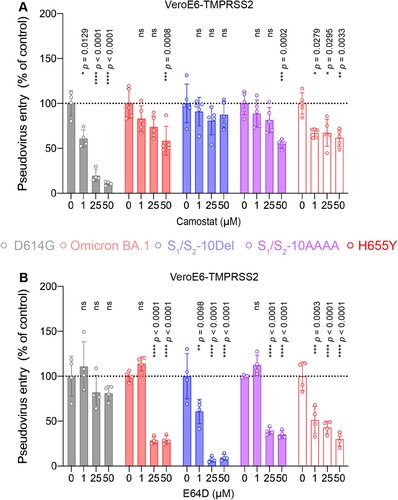
Figure 6. The H655Y substitution in Omicron BA.1 and BA.2 spike promotes endosomal entry. (A–B) VeroE6-TMPRSS2 cells were pre-treated with 1, 25, or 50μM camostat (A) or E64D (B) or DMSO (A–B) for 2 h followed by transduction with pseudoviruses expressing the indicated spike at 24 h post-transfection. Pseudovirus entry was quantified by measuring the luciferase signal (n = 5 for camostat treatment of Omicron BA.1, S1/S2-10Del, S1/S2-AAAA, and H655Y; n = 4 for the other groups). Data represent mean ± SD from the indicated number of biological repeats. Statistical significances were determined with one way-ANOVA. Data were obtained from three independent experiments. Each data point represents one biological repeat. * represented p < 0.05, ** represented p < 0.01, *** represented p < 0.001, and **** represented p < 0.0001. ns, not statistically significant.