Figures & data
Table 1. Primers used in this study for sequencing.
Figure 1. Identification of CVA6 strains in clinical isolates from HFMD patients. (A) A genetic evolutionary tree of CVA6 VP1 (926 bp) by using the neighbor-joining method. (B) Transmission electron micrograph of the infected Vero cells and CVA6 virions. The black arrows indicate spherical particles of the CVA6 virions with a diameter of 26–35 nm; (C) The relative expression of CVA6 VP1 and cleaved-Caspase-3.
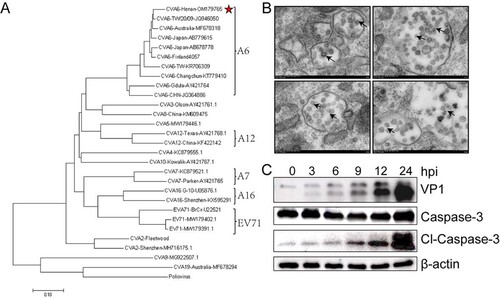
Figure 2. Establishment of the CVA6 infection mouse model. Ten-day-old ICR mice (n = 10–15 per group) were i.p. inoculated with different doses of CVA6 (100 TCID50–105 TCID50), respectively. Control animals were administered muscle homogenate supernatant from normal mice instead of virus. The body weights (A, D, G), survival rates (B, E, H), and clinical scores (C, F, I) in each group of mice were measured. Two representative pictures (J, K) of clinical signs (weight loss, reduced mobility, ataxia, and single or double hind limb paralysis) caused by CVA6 in mice. *P < 0.05; **P < 0.01; ***P < 0.001; ****P < 0.0001; ns, non-significant result.
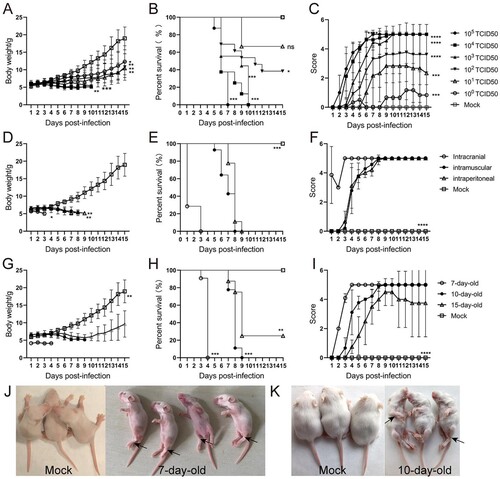
Figure 3. CVA6 triggers inflammation-associated CNS damage. (A) H&E and Nissl’s staining of brain and spinal cord slices. Number of neurons were count at 3 dpi or 7 dpi. (B) The CVA6 antigens in brain and spinal cord tissues were determined by IHC. (C) The copy number of VP1 genome in brains at 3 dpi, 5 dpi and 7 dpi. (D) The number of inflammatory cells in the brains of CVA6 infected and uninfected mice. (E, F, G) Statistical results of neutrophils, monocytes and macrophages in the brains of CVA6 infected and uninfected mice. (H) The expression levels of cytokines (TNFα, IL-10, MCP-1, IL-6, IL-1β) in grinding supernatant of brains measured by ELISA. (I) The relative expression of GFAP and apoptosis proteins (cleaved-Caspase-3) in the brains of CVA6 infected and uninfected mice. *P < 0.05; **P < 0.01; ***P < 0.001; ****P < 0.0001.
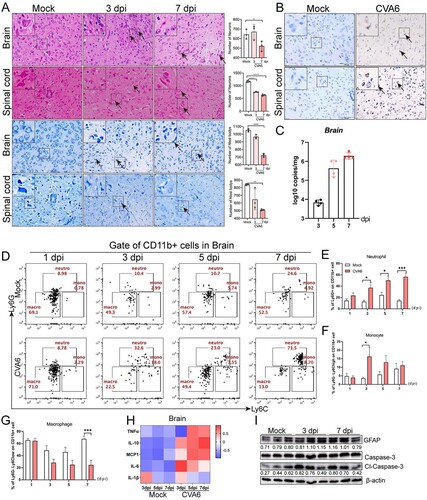
Figure 4. Systemic manifestations triggered by CVA6. (A) The pathology changes of skeletal muscles, lungs, hearts, intestines, livers and kidneys were determined by H&E staining. The black arrows indicate characteristic lesions. (B) The viral antigens were diffusely distributed in all the isolated tissues; no antigen was detected in the control group. The black arrows indicate locations of antigens. (C) The copy number of CVA6 VP1 in muscles (C-a), lungs (C-b), hearts (C-c), intestines (C-d), livers (C-e) and kidneys (C-f) at 3 dpi, 5 dpi and 7 dpi were determined by quantitative PCR. Results are normalized by β-actin from the same organs/tissues. (D) Liver functions (ALT (D-a), AST (D-b), TBIL (D-c), DBIL (D-d), ALB (D-e), ALP (D-f), TBA (D-g) and γ-GT (D-h)) and (E) renal functions (UREA (E-a), UA (E-b), CERA (E-c)) in serums of mice at 3 dpi and 5 dpi were detected by automatic biochemical analyzer. (F) The expression levels of cytokines (TNF-α, IL-10, MCP-1, IL-6, IL-1β) in grinding supernatant of muscles in mice were measured by ELISA. (G) The concentrations of cytokines (TNF-α, IL-10, MCP-1, IL-6, IL-1β) in serums of mock and CVA6 infected mice were measured by ELISA. *P < 0.05; **P < 0.01; ***P < 0.001; ****P < 0.0001.
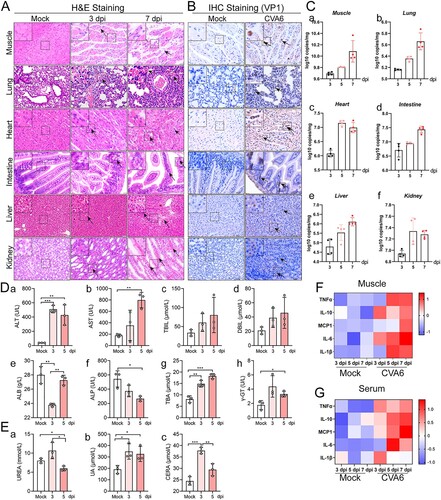
Figure 5. Oral inoculation of mouse-adapted CVA6 results in mortality. Ten-day-old ICR mice (n = 10–15 per group) were i.g. inoculated with doses of CVA6 (105 TCID50), respectively. Mock animals were administered muscle homogenate supernatant from normal mice instead of virus. The body weights (A), mean clinical scores (B) and survival rates (C) in each group of neonatal mice were recorded. (D) Representative pictures of organs in mock-infected mice (D-a) and CV6-infected mice (D-b). (E) The pathologies of different organs (brains, spinal cords, hearts, lungs, muscles, livers, kidneys, stomachs, spleens, skins, upper jaws, down jaws, tongues, claws) from mice infected with CVA6. No pathological change was observed in the control group. (F) The viral antigens were distributed in fourteen isolated tissues. No antigen was detected in the control group treated with the muscle homogenate supernatant from normal mice. The black arrows indicate characteristic lesions and locations of antigens. *P < 0.05; **P < 0.01; ***P < 0.001; ****P < 0.0001.
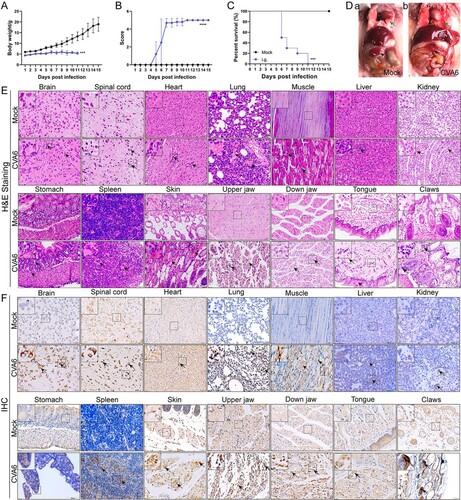
Figure 6. CVA6 leads to immune system activation. The 10-day-old ICR mice were i.p. inoculated with 104 TCID50 CVA6 strain. At 1 dpi, 3 dpi, 5 dpi and 7 dpi, control and infected mice (n = 7–10) were euthanized. FACS was used to detect the characteristics of immune cells in spleen of CVA6 infected and uninfected mice. (A) The number of neutrophils and monocytes in spleens of mice. (B) The number of macrophages and MDSCs in spleens of mice. (C, D) Statistical results of immune cells and inflammatory cells in the spleens of CVA6 infected and uninfected mice. *P < 0.05; **P < 0.01; ***P < 0.001; ****P < 0.0001.
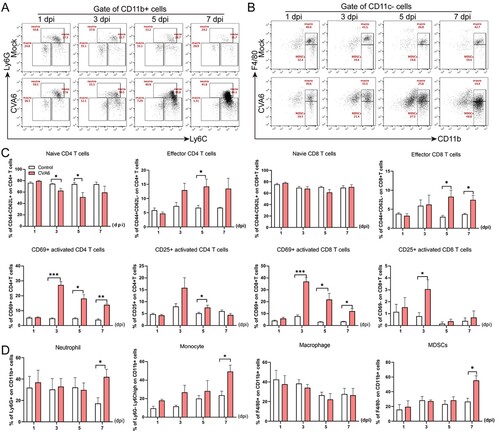
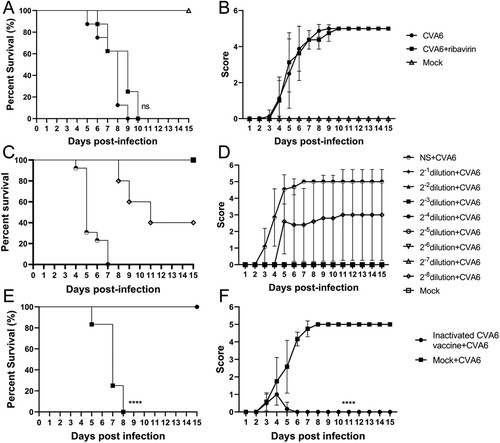
Figure 7. Protective efficacy of ribavirin, CVA6 antiserum and inactivated whole-virus vaccine against CVA6 challenge in vivo. (A, B) Effect of ribavirin. (C, D) Effect of passive immunization. (E, F) Effect of active immunization. The survival rates (A, C, E) and Clinical symptoms (B, D, F) were monitored and recorded daily for 15 days after inoculation with CVA6. ****P < 0.0001.