
Figures & data
Figure 1. Construction of the m8Δ-based vaccines. (A) Schematic of the vaccines. Characteristic polybasic sequences are listed above the S1/S2 cleavage sites, indicated by scissors. Arrows indicate the primers used for validation by PCR. m8Δ-S, m8Δ-SARS2(P7.5-S)-HA; m8Δ-SHN, m8Δ-SARS2(P7.5-SHN)-HA; SP, signal peptide; G, VSV G protein-derived membrane anchor; L, left arm; R, right arm. (B) Validation of the recombinant viruses by conducting PCR with the indicated primer pairs. The indicated viral DNA was used as the template. bp, base pair. (C) Loss of HA expression in the recombinant viruses. Three days after RK13 cells were inoculated with the indicated recombinant viruses at a dose of 50–100 plaque-forming units per 7.5×10⁵ cells, they were used in a haemadsorption assay. Data are representative from two independent experiments with similar results. Scale bars, 1 mm.
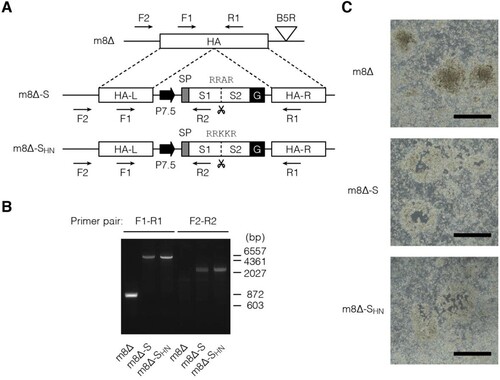
Figure 2. In vitro expression of the S protein. (A) Immunoblotting of HEK293T cells that were inoculated with the indicated recombinant viruses at an MOI of 1 or mock infected one day before the analysis. Antibody targets are shown on the left side of the panels. The cleaved form frequency was calculated via densitometry from three independent experiments and is shown as the mean±SEM. Glyceraldehyde 3-phosphate dehydrogenase (GAPDH) was used as a loading control. m8Δ-S, m8Δ-SARS2(P7.5-S)-HA; m8Δ-SHN, m8Δ-SARS2(P7.5-SHN)-HA. (B) Immunofluorescence assays of HEK293T cells that were inoculated with the indicated viruses at an MOI of 0.1 one day before the analysis. SARS-CoV-2 S2 (green) and nuclei (blue) were visualized on the non-permeabilized formalin-fixed cells. Data are representative of three (A) or at least two (B) independent experiments. Scale bars, 10 µm.
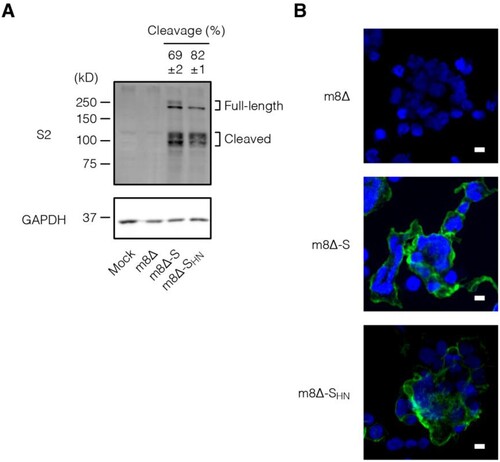
Figure 3. Antibody production induced by immunization with the m8Δ-based vaccines. (A) Experimental outline. (B) Time course of the antibody levels after primary immunization with the indicated virus. The antibody levels were measured by ELISA using diluted serum samples (1:200). The dilution factor of 200 corresponded to the 50% effective concentration of the serum samples obtained six weeks after the boost immunization. Symbols and bars represent the means and SEM, respectively. A414, absorbance at 414 nm; m8Δ-S, m8Δ-SARS2(P7.5-S)-HA; m8Δ-SHN, m8Δ-SARS2(P7.5-SHN)-HA. (C) Endpoint titres of the indicated antibodies six weeks after the primary (×1) or boost (×2) immunization. Titres of <100 are listed as not determined (ND). The proportions of samples with measurable titres are shown in parentheses. Each symbol represents an individual mouse. Horizontal lines represent geometric means. Data were pooled from three independent experiments using four or more mice per experimental group. Data at each time point in (B) were analysed by Tukey test. The statistical significance of the difference from the m8Δ×2 group is indicated by * near the individual symbols. The log-transformed data in (C) were analysed by a Welch t-test. ***P < 0.001, **P < 0.01, *P < 0.05.
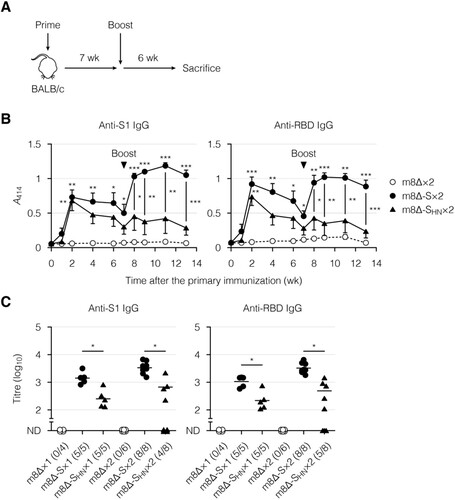
Figure 4. Neutralizing activity of the serum after immunization with the m8Δ-based vaccines. (A) Neutralization of the Wuhan-Hu-1 pseudovirus by the serum samples in a concentration-dependent manner, as determined by luciferase assay. The pseudovirus was incubated with the serum samples obtained six weeks after the boost (×2) immunization with the indicated virus. m8Δ-S, m8Δ-SARS2(P7.5-S)-HA; m8Δ-SHN, m8Δ-SARS2(P7.5-SHN)-HA. (B) Neutralizing activities of the serum samples obtained six weeks after the primary (×1) or boost immunization with the indicated virus. The proportions of samples with measurable neutralizing activity are shown in parentheses. NT50, 50% neutralizing concentration; ND, not determined. (C) Neutralizing activities of the serum samples described in (B) obtained six weeks after the boost immunization with m8Δ-S, as measured using the indicated pseudovirus. (D) Neutralization of the Wuhan SARS-CoV-2 by the serum samples described in (A) in a concentration-dependent manner, as determined by crystal violet assay. Serum samples lacking neutralizing activity against the Wuhan-Hu-1 pseudovirus were excluded. A570, absorbance at 570 nm. (E) Neutralizing activities of the serum samples described in (D). (F) Neutralizing activities of the serum samples described in (C) against the indicated SARS-CoV-2. Serum samples displaying neutralizing activity against the corresponding pseudovirus were analysed. Symbols and bars in (A,D) represent the means and SEM, respectively. Each symbol in (B,C,E,F) represents an individual mouse or patient. The same serum samples are linked in (C,F). Horizontal lines in (B,C,E,F) represent the geometric means. Data were pooled from three independent experiments using four or more mice per experimental group. The log-transformed data in (B,C,E,F) were analysed by an unpaired (B,E) or paired Welch t-test (C,F). *P < 0.05. NS, not statistically significant.
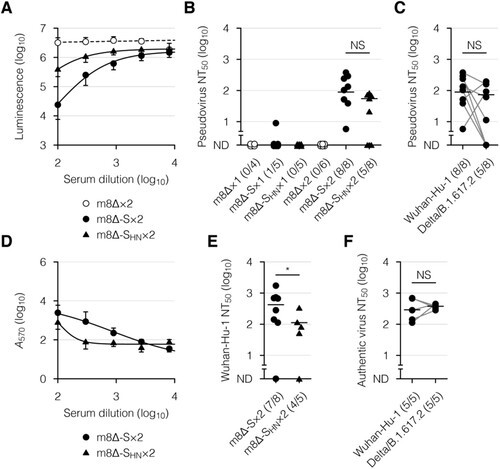
Figure 5. Cellular immune responses to the m8Δ-based vaccines as measured by an ELISpot assay. Splenocytes were obtained six weeks after the primary (×1) or boost (×2) immunization with the indicated virus. IFN-γ spot-forming units (SFU) were measured after in vitro stimulation with or without the indicated peptide. Each symbol represents an individual mouse. Horizontal lines represent the geometric means. Data were pooled from two or three independent experiments using four or more mice per experimental group. m8Δ-S, m8Δ-SARS2(P7.5-S)-HA; m8Δ-SHN, m8Δ-SARS2(P7.5-SHN)-HA. The log-transformed data from after the primary or boost immunization were analysed individually by a Tukey test. Combinations without mark are not statistically different. ***P < 0.001, **P < 0.01, *P < 0.05.
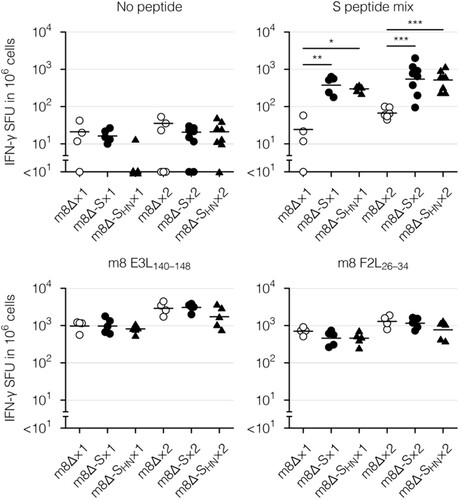
Figure 6. Cytokine profiles of the CD8+ memory T cells. (A) Frequencies and absolute numbers of the CD8+ effector memory T (TEM) cells reactive to the S peptide mix, as measured by intracellular cytokine staining. Splenocytes were obtained six weeks after the primary (×1) or boost (×2) immunization with the indicated virus. The gating strategy applied to isolate the CD8+ TEM cells is shown in Supplementary . Cytokine-producing cells were identified as shown in Supplementary (A). Each symbol represents an individual mouse. Horizontal lines represent the means (upper panels) or geometric means (lower panels). Data were pooled from two independent experiments using four or more mice per experimental group. m8Δ-S, m8Δ-SARS2(P7.5-S)-HA; m8Δ-SHN, m8Δ-SARS2(P7.5-SHN)-HA. (B) Percentages of the S peptide mix-reactive CD8+ TEM cells described in (A) that expressed the indicated number of cytokines among IFN-γ, TNF-α, and IL-2. The data shown in (A, upper panels) and the log-transformed data shown in (A, lower panels) after the primary and boost immunization were analysed individually by a Tukey test. Combinations without mark are not statistically different. ***P < 0.001, **P < 0.01, *P < 0.05.
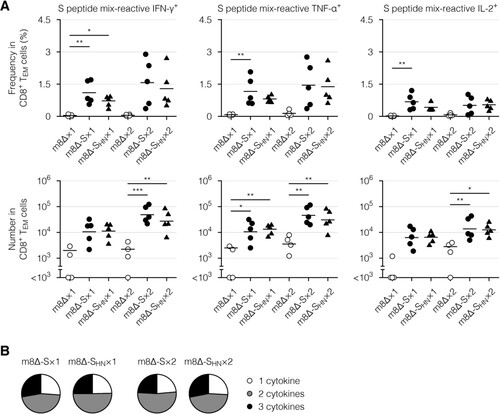
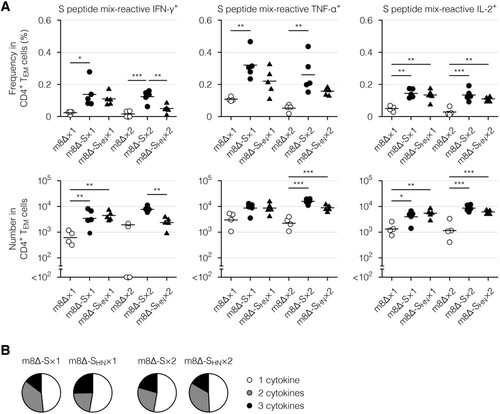
Figure 7. Cytokine profiles of the CD4+ memory T cells. (A) Frequencies and absolute numbers of the CD4+ effector memory T (TEM) cells reactive to the S peptide mix, as measured by intracellular cytokine staining. Splenocytes were obtained six weeks after the primary (×1) or boost (×2) immunization with the indicated virus. The gating strategy applied to isolate the CD4+ TEM cells is shown in Supplementary . The cytokine-producing cells were identified as shown in Supplementary (B). Each symbol represents an individual mouse. Horizontal lines represent the means (upper panels) or geometric means (lower panels). Data were pooled from two independent experiments using four or more mice per experimental group. m8Δ-S, m8Δ-SARS2(P7.5-S)-HA; m8Δ-SHN, m8Δ-SARS2(P7.5-SHN)-HA. (B) Percentages of the S peptide mix-reactive CD4+ TEM cells described in (A) that expressed the indicated number of cytokines among IFN-γ, TNF-α, and IL-2. The data shown in (A, upper panels) and the log-transformed data shown in (A, lower panels) after the primary and boost immunization were analysed individually by a Tukey test. Combinations without mark are not statistically different. ***P < 0.001, **P < 0.01, *P < 0.05.
Supplemental Material
Download MS Word (29.1 MB)Data availability statement
The authors confirm that the data supporting the findings of this study are available within the article and its supplementary materials.