Figures & data
Table 1. Baseline characteristics of participants infected with Omicron.
Figure 1. Kaplan–Meier Curve for COVID-19 Nucleic Acid Viral Shedding Time. A. Viral shedding time among participants more or less than 70 years old; B. Viral shedding time between participants with and without chronic kidney disease stage 4–5; C. Viral shedding time between participants with and without heart conditions; D. Viral shedding time between participants not fully vaccinated and fully vaccinated or booster.
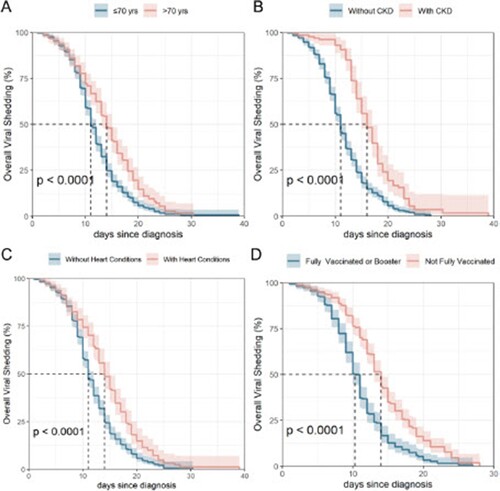
Table 2. Multivariate Cox regression of factors associated with COVID-19 nucleic acid viral shedding time.
Table 3. Multivariate logistics regression of factors associated with severity progression.
Table 4. Characteristics of participants with high-risk comorbidities for severity progression.
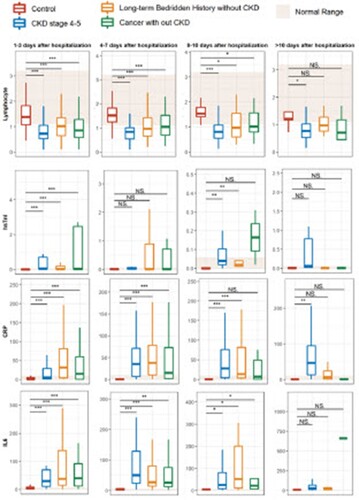
Figure 2. Dynamic laboratory examination monitoring in patients with high-risk comorbidities.