Figures & data
Figure 1. MVSA Vaccine Design. Immunoinformatic approaches implemented to design vaccine construct against GBS.
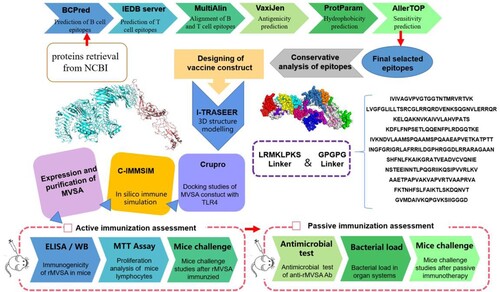
Table 1. The 15 candidate proteins against GBS.
Figure 2. Conservative analysis of predicted 11 epitopes on 10 serotypes of GBS. The phylogenetic tree was reconstructed based on the CPS cluster from 159 GBS genomes. The first layer showed strain ID and the serotypes. The second layer showed the distribution of 11 epitopes while the filled circles represented the epitope existed in the corresponding GBS strain, and hollow circles meant the epitope was not distributed in the corresponding GBS strain. The third layer showed the host source of GBS strains. The first layer to the third layer is from inward to outward.
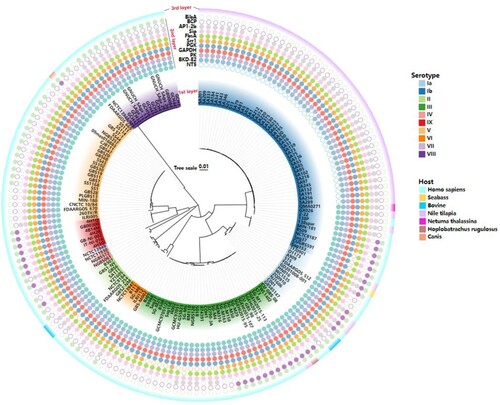
Table 2. Selected epitopes with affinity for B and T lymphocytes and antigenic score.
Figure 3. MVSA 3D structural analysis and molecular docking (A) The tertiary structure of the MVSA. The various epitopes were indicated by different colours; the white region represented the linkers “GPGPG”and “LRMKLPKS.” (B) Diagram of docking mode of the MVSA-TLR4 complex. (C) Docked conformation and hydrogen bond interaction map of MVSA (shown in blue) to TLR4 (shown in pink), and the black dotted lines referred to hydrogen bonds. (D) The interacting residues between docked MVSA and TLR4.
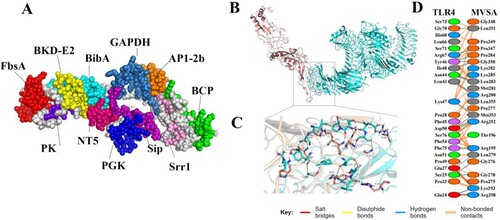
Figure 4. In silico cloning of the MVSA in the pET28a (+) and expression. (A) Cloning and expression of MVSA in pET28a(+) vector. The 11 epitopes were fused together in proper order by the appropriate linkers. Agarose gel showing MVSA was amplified by primers MVSA-P1/P2 (B) and T7/T7RVERS(C). Lanes 1–2: pET-28a-MVSA-BL21; Lane 3: pET-28a-MVSA; Lanes 4: negative control. (D) SDS-PAGE gel showing rMVSA expression after sonication. rMVSA was induced by 1 mM IPTG for incubation 5 h at 37°C (lanes 1–2), 0.5 mM IPTG for incubation 14 h at 28°C (lanes 3–4), 1 mM IPTG for incubation 16 h at 16°C (lanes 5–6) and 0.5 mM IPTG for incubation 16 h at 37°C (lanes 7–8). rMVSA in Lanes 1, 3, 5, 7 were expressed in the supernatant, and rMVSA from lanes 2, 4, 6, and 8 were in inclusion bodies.
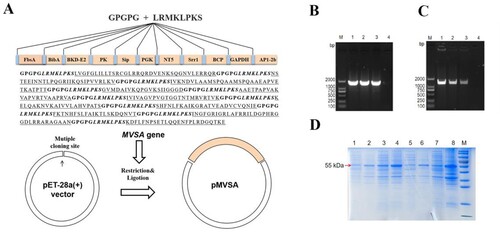
Figure 5. MVSA active immune protection assessment. Timeline for active immunization of MVSA vaccine regimen, comprising of an initial prime, 2 boosts, 4 bleeding and final infecting. Mice were stratified into rMVSA immunized group or sham immunized control group. (B) The antibody titres induced by rMVSA at each immunization. (C) rMVSA protein was purified with Ni-NTA agarose shown in the left SDS-PAGE gel and the reactivity of anti-rMVSA serum with rMVSA was tested in western blot on the right. (D) The survival curves for rMVSA-immunized and sham-immunized mice challenged with 20×LD50 of ATCC BAA-611 strain (**, p <0.01). (E) Proliferation of lymphocytes isolated from rMVSA-immunized and sham-immunized mice and treated with rMVSA6 protein for 72 h. (F) Cytokine levels of splenocytes isolated from immunized mice after stimulation with rMVSA. Significance (P)-value summary analysed by Unpaired two-tailed Student’s t-test (*, p < 0.05; **, p < 0.01; ***, p < 0.001; ****, p < 0.0001; ns, no significance).
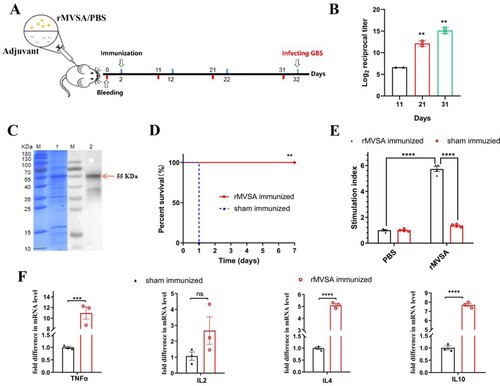
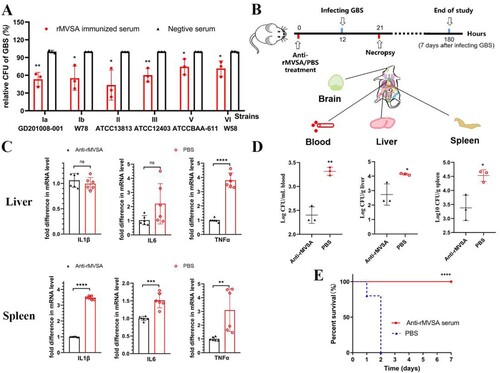
Figure 6. MVSA passive immune protection assessment. (A) The antibacterial activity of anti-rMVSA serum against various serotypes GBS strains. (B) Schematic representation of passive immune protection schedules of anti-MVSA serum, containing immunization, infecting and necropsy. Mice were stratified into anti-rMVSA serum group or PBS control group. (C) Cytokine transcription Levels in two organs (Liver and Spleen) of mice from different groups. (D) Viable bacterial counts for tissues from different groups of challenged mice. (E) The survival curve for anti-rMVSA serum and PBS groups mice challenged with 20 × LD50 of ATCC BAA-611 strain (****, p <0.0001). Significance (P)-value summary analysed by Unpaired two-tailed Student’s t-test (*, p < 0.05; **, p < 0.01; ***, p < 0.001; ****, p < .0001; ns, no significance).