Figures & data
Figure 1. Differential distribution of HBV X gene haplotypes and genotypes exists between intra-patient tumour and adjacent non-tumour tissues in patients with HCC (A) Distributions of the haplotypes of the HBV X gene in the intra-patient tumour and non-tumour tissues. (B-E) Comparisons of the heterogeneity of HBV quasispecies (QS) across the X gene between tumour and non-tumour tissues. (B and C) The comparisons of the complexity quantified using Sn in the nucleotide (B) and amino acid level (C). (D and E) The comparisons of diversity were quantified using D at the amino acid level (D) and quantified using D, dS and dN at the nucleotide level (E). Sn, Shannon entropy. D, Genetic distance. dS, Number of synonymous substitutions per synonymous site. dN, number of non-synonymous substitutions per non-synonymous site. Each paired symbols represent the same patient's tumour tissue and adjacent non-tumour tissue; Paired t test; Paired n = 24. (F) Representative phylogenetic trees of HBV QS across the X gene from the liver tissue in patients with HCC. The solid red and blue dots indicate that the haplotypes are isolated from the tumour tissue and non-tumour tissue, respectively. The green, blue, red, purple and cyan hollow squares indicate the reference sequences for genotypes A, B, C, D and E, respectively. (G-K) All clones of the HBV X gene isolated from patients 4, 11, 12, 13 and 23 were genotyped using the phylogenetic trees. An online genotyping tool was used for the validation (https://www.ncbi.nlm.nih.gov/projects/genotyping/genotype.cgi). On the phylogenetic trees, the solid red and blue dots indicate that the clones are isolated from the tumour tissue and non-tumour tissue, respectively, and the green, blue, red, purple and cyan hollow squares indicate the reference sequences for genotypes A, B, C, D and E, respectively. (L) Numbers of genotyped clones with genotypes B, C and D were counted and compared between tumour and non-tumour tissues. The clones with the recombination of genotype B and C were found in patient 13 and counted as genotype B. Chi-square test was used to compare the difference of genotype distribution.
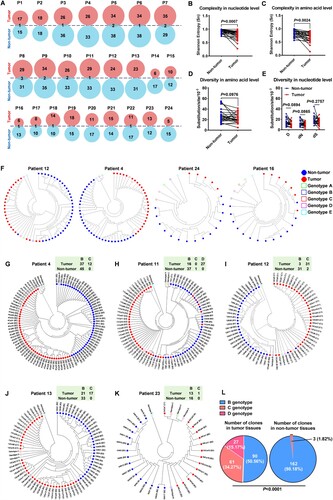
Figure 2. L123S mutation increases and exists in linkage with S101P or S101P plus T81P in the liver tumour tissues (A-C) Mutations at each amino acid site across the X gene were assessed using Shannon entropy (Sn). An online tool was used to calculate and illustrate Sn (https://www.hiv.lanl.gov/content/sequence/ENTROPY/entropy.html). (A) Sn at each amino acid site in genotype-B clones. (b) Sn at each amino acid site in genotype-C and genotype-D clones. (C) Differences in Sn at each amino acid site between genotype-B and genotype-(C&D) clones; Significant sites with P≤0.05 are shown in red bars. (D-F) Average mutation frequency across different fragments within the X gene was assessed via average entropy. (D) Average entropy across the whole X gene. (E) Average entropy of dimerization region from amino acid 21 to amino acid 50. (F) Average entropy between amino acid 110 to amino acid140 within the transactivation region. (G-I) Shannon entropy (Sn) at each amino acid site was used to analyse the mutations across the HBV X gene for the clones isolated from the tumour tissues or non-tumour tissues. (G) Sn at each amino acid site in non-tumour tissues (n = 680). (H) Sn at each amino acid site in tumour tissues (n = 711). (I) Differences in Sn at each amino acid site between non-tumour and tumour tissues; Significant sites with P≤0.05 are shown in red bars. (J) A schematic diagram of the functional domains of HBV X protein. (K) The number of the significant sites which have higher mutation frequencies, located within the transactivation domain or strongly conserved region are displayed in the Venn diagram. (L) Significant sites, including x111, x119, x123 and x134, with higher mutation frequencies, located within the transactivation domain and strongly conserved region simultaneously are displayed in the volcano plot. (M) Clones of HBV X genes harbouring mutation L123S, double mutation S101P/L123S and triple mutation T81P/S101P/L123S are displayed in the Sankey diagram. (N) Three-dimensional structures of wild-type and mutant HBx proteins. WT, wild type. SM, single mutation, refers to L123S. DM, double mutation, refers to S101P/L123S. TM, triple mutation, refers to T81P/S101P/L123S.
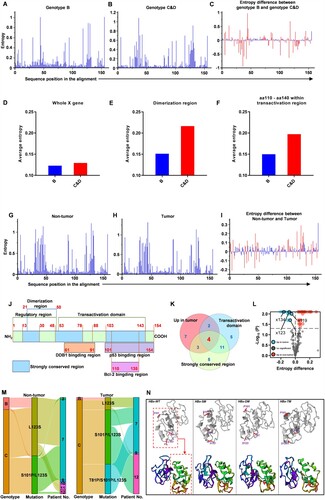
Figure 3. HBx-T81P/S101P/L123S upregulates the level of MYC compared with wild-type HBx (A) Protein dockings between wild-type HBx and MYC or between mutant HBx and MYC were predicted in silico. Three dimensional structures of wild-type HBx, mutant HBx and MYC are displayed respectively at the top of the panel. Three dimensional structures of docking between wild-type HBx and MYC or between mutant HBx and MYC are displayed in the middle and bottom of the panel. (B and C) The mRNA expressions of MYC in Huh 7 (B) and Bel-7404 (C) were assessed using a quantitative polymerase chain reaction. Each symbol represents an individual experiment; Data are presented as mean ± standard error of the mean; Unpaired t test; n = 3. (D and E) Protein levels of MYC in hepatocellular carcinoma cells. Western blot was used to assess the protein level of MYC in the Vector, WT, SM, DM and TM groups in Huh 7 (D) and Bel-7404 (E) cells, respectively. β-actin was used as a loading control. (F) The transcriptional activity of MYC promoter was assessed by the luciferase assays in 293T cells after the plasmid pMYC-promoter was co-transfected with pcHBx-WT, pcHBx-SM, pcHBx-DM or pcHBx-TM into 293T cells; Data are presented as mean ± standard error of the mean; Unpaired t test; n = 3. (G and H) The interactions between wild – or mutant-type HBx and MYC were assessed by the co-immunoprecipitation assays. After MYC-Flag (G) or HBx (H) was immunoprecipitated, the western blot assays were performed to detect the protein levels of HBx (G) and MYC (H) in Huh 7 cells. (I) The western blot assays were used to analyse the change of MYC protein level at 0th, 30th, 60th and 90th minute after the treatment of cycloheximide (CHX) at a final concentration of 25 μg/mL in the Huh 7 cells transiently expressing HBx-WT, HBx-SM, HBx-DM or HBx-TM. (J) The western blot assays were used to assess the ubiquitination levels of MYC by the antibody aginst the ubiquitin after the MYC-Flag was immunoprecipitated in the Huh 7 cells transiently expressing HBx-WT, HBx-SM, HBx-DM or HBx-TM.
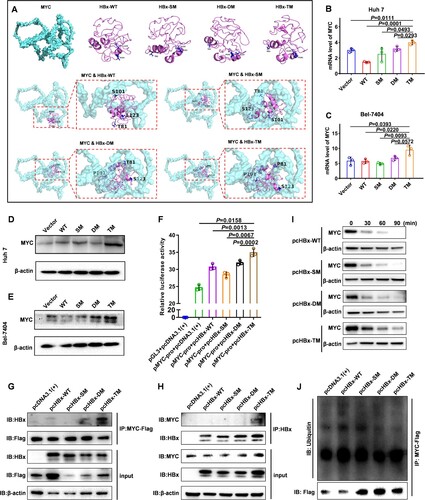
Figure 4. HBx-T81P/S101P/L123S promotes the growth and proliferation of hepatocellular carcinoma (HCC) cells compared with wild-type HBx (A) Tumour masses harvested from the nude mice injected subcutaneously with Huh 7 cells. A total of 1 × 10⁷ Huh 7 cells stably transfected with Lv-Vector, Lv-HBx-WT, Lv-HBx-SM, Lv-HBx-DM or Lv-TM in 100 μl phosphate buffer solution was independently injected subcutaneously into the right-back of eight nude mice. (B and C) Weight (B) and volume (C) of tumour masses were assessed on the 28th day after the inoculation. Data are presented as mean ± standard error of mean (SEM); Unpaired t test; Each symbol represents an individual tumour tissue; n = 8 for the Vector, SM, DM and TM group; n = 7 for the WT group. (D) Cell viabilities of Huh 7 cells were assessed by cell counting kit-8 (CCK-8) assays. A total of 1 × 10⁴ Huh 7 cells were seeded and cultured for 12 h in each well of a 96-well plate. Subsequently, CCK-8 assays were performed at four time points (0, 12, 24, 48 h) among the Vector, WT, SM, DM and TM groups; Data are presented as mean ± SEM. Unpaired t-test; n = 6. (E) Protein levels of E2F1, Rb and pRb in Huh 7 cells were assessed using western blot. β-actin was used as a loading control. E2F1, E2F Transcription Factor 1. Rb, RB Transcriptional Corepressor 1. pRb, phosphorylated Rb. (F) Colony formation assays were performed to evaluate the single-cell growth ability in Huh 7 cells. Differences in colony numbers among the Vector, WT, SM, DM and TM groups are presented on the right of the panel; Data are presented as mean ± SEM; Unpaired t test; n = 3. (G) Cell cycles were analysed using flow cytometry of Huh 7 cells. Propidium iodide (PI) was used for the detection of DNA contents. G1 phase, first growth phase or post mitotic gap phase. S phase, DNA replication phase. G2 phase, cell growth phase. Proportions of cells in the S phase in the Vector, WT, SM, DM and TM groups are presented at the right of the panel; Each symbol represents an individual experiment. Data are presented as mean ± SEM; Unpaired t test; n = 3. (H) Levels of DNA replication were examined using 5-ethynyl-2'-deoxyuridine (EdU) incorporation assays in Huh 7 cells. EdU with Alexa Fluor 555 showing red fluorescence was used to label the DNAs replicating. The Hoechst stain with blue fluorescence was used to label the general DNAs. The proportions of cells with EdU staining in the Vector, WT, SM, DM and TM groups are presented at the right of the panel; Each symbol represents an individual experiment; Data are presented as mean ± SEM; Unpaired t test. n = 3; Original magnification, ×400.
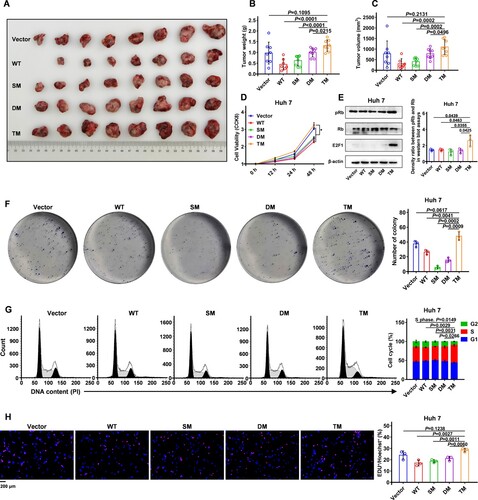
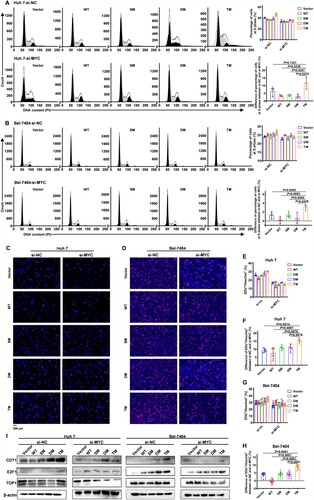
Figure 5. Knockdown of MYC can abrogate the tumour-promoting effect of HBx conferred by mutation T81P/S101P/L123S (A and B) Cell cycles were assessed using flow cytometry in Huh 7 cells (A) and Bel-7404 cells (B). The siRNA (10 pmol) of MYC or the control was transfected into Huh 7 cells and Bel-7404 cells in a 6-well dish, respectively. The ratios of cells in the S phase among the Vector, WT, SM, DM and TM groups are presented on the right at the top of the panel in (A) or (B); Each symbol represents an individual experiment. The differences in the ratios of cells in the S phase between cells transfected with si-MYC and with si-NC are presented on the right at the bottom of the panel in (A) or (B); Each symbol represents a difference in the ratios of cells in the S phase between a certain cell transfected with si-MYC and a matched cell transfected with si-NC. Data on the right of the panel in (A and B) are presented as mean ± standard error of mean (SEM); Unpaired t test; n = 3. (C-H) Levels of DNA replication were examined by the EdU incorporation assays in HCC cells. The siRNA (10 pmol) of MYC or the control was transfected into Huh 7 cells and Bel-7404 cells in a 6-well dish respectively. (C and D) the representative figures reflecting the replicating cells labelled by EdU in Huh 7 cells (C) and Bel-7404 cells (D) are displayed. The nuclei labelled by EdU in the replicating cells show the red fluorescence. The general nuclei labelled using Hoechst show the blue fluorescence. Original magnification, ×400. (E and G) The ratios of cells labelled by EdU among the Vector, WT, SM, DM and TM groups in Huh 7 cells (E) and Bel-7404 cells (G) are presented. Each symbol represents an individual experiment. (F and H) The differences in the ratios of cells labelled by EdU in Huh 7 cells (F) and Bel-7404 cells (H) between cells transfected with si-MYC and with si-NC are presented. Each symbol represents a difference in the ratios of cells labelled by EdU between a certain cell transfected with si-MYC and a matched cell transfected with si-NC. Data in (E-H) are presented as mean ± SEM; Unpaired t test; n = 4 in Huh 7 cells; n = 8 in Bel-7404 cells. (I) Protein levels of CDT1, E2F1 and TOP1 in HCC cells were assessed by the western blot among the Vector, WT, SM, DM and TM groups. The siRNA (10 pmol) of MYC or the control was transfected into Huh 7 cells (left of the panel) and Bel-7404 cells (right of the panel) in a 6-well dish respectively. β-actin was used as a loading control. TOP1, DNA Topoisomerase I.