Figures & data
Table 1. Demographic characteristics of COVID-19 patients and treatments they received.
Table 2. Biochemical parameters of patients.
Figure 1. The evaluation of the effect of C-Vx on T and NK cell ratios and NK cell cytotoxicity. (A) CD3+ total T, (B) CD3−CD16+CD56+ NK, (C) CD4+, (D) CD8+ T cell frequencies, and (E) CD107a expression of NK cells in patient groups and healthy donors with and without C-Vx. (*p < 0.05, **p < 0.001, ***p < 0.0001) (US: unstimulated, HD: healthy donors).
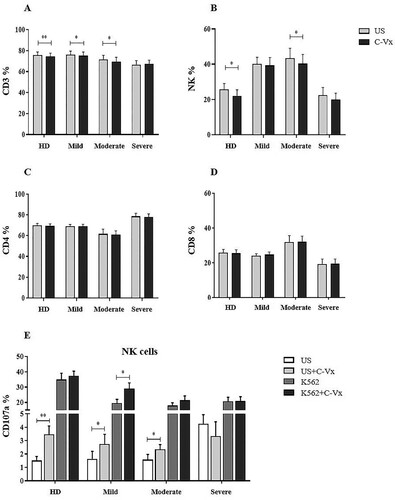
Figure 2. The alterations in intracellular cytokine levels of T cell subsets in response to C-Vx. IFN-γ, IL-17, TNF-α, IL-4, and IL-10 levels of (A) CD4+ and (B) CD8+ T cells after culture of PBMCs stimulated or not with C-Vx. (*p < 0.05, **p < 0.001, ***p < 0.0001) (US: unstimulated, HD: healthy donors).
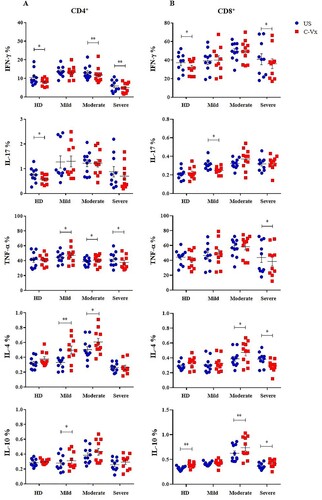
Figure 3. Determination of lymphocyte proliferation in response to C-Vx. The proliferation capacities of (A) total lymphocytes, (B) CD3+ T cells, (C) CD3−CD16+CD56+ NK cells, (D) CD4+, and (E) CD8+ T cell subsets after cell culture with/without PHA stimulation with or without C-Vx. (*p < 0.05, **p < 0.001, ***p < 0.0001) (US: unstimulated, HD: healthy donors).
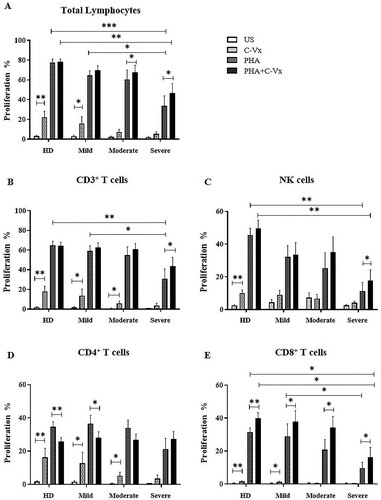
Figure 4. Bradykinin, IRF3, and IFN-α levels in response to C-Vx. The effects of C-Vx addition on (A) IRF3, (B) Bradykinin, and (C) IFN-α levels in plasma and culture supernatants were measured by ELISA method (*p < 0.05, **p < 0.001, ***p < 0.0001) (US: unstimulated, HD: healthy donors).
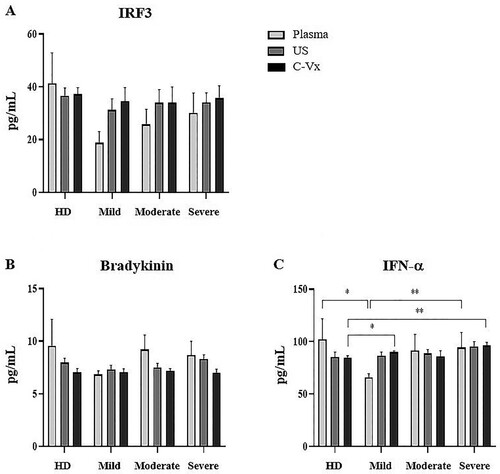
Figure 5. The alterations in cytokine levels after C-Vx addition. IL-1β, IL-2, IL-4, IL-5, IL-6, IL-8, IL-10, IL-12p70, IL-13, IFN-γ, TNF-α, and GM-CSF levels were measured by multiplex assay in supernatants of cultured PBMCs of patients and healthy donors with/without C-Vx. (*p < 0.05, **p < 0.001, ***p < 0.0001) (US: unstimulated, HD: healthy donors).
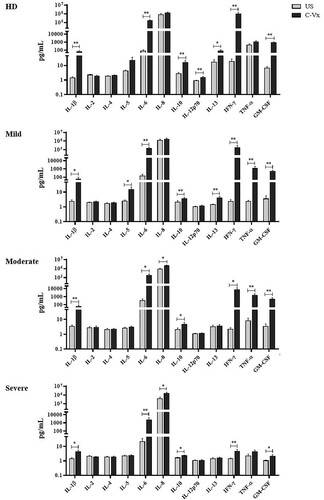
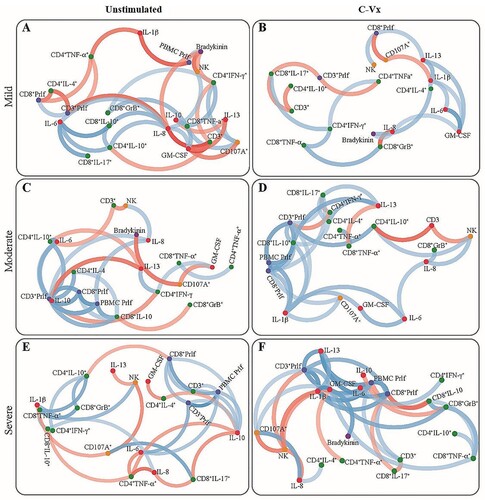
Figure 6. The network analysis of immune parameters in COVID-19 patients with/without C-Vx. Blue and red lines indicate positive and negative correlations. The significance of correlations increases in proportion with increased darkness of line colours. (US: unstimulated).