
Figures & data
Figure 1. nsp1 promotes the accumulation of autophagosomes. (A) HEK 293 T and A549 cells were transfected with the indicated plasmids for 36 h, after which cell lysates were analyzed by immunoblotting. HEK 293T were transfected with the nsp1 plasmid for the indicated times (B) or different doses (C), and cell lysates were analyzed by immunoblotting. (D) HEK 293 T cells were co-transfected with the indicated plasmids for 36 h, after which confocal microscopy was performed to analyze the EGFP-LC3+ dots; RAPA was used to induce autophagy. (E) HEK 293 T cells were transfected with the indicated plasmids for 36 h, and cell lysates were analyzed by immunoblotting. (F) HEK 293T cells were co-transfected with the indicated plasmids for 36 h, and EGFP-LC3+ dots were analyzed by confocal microscopy. (G) HEK 293 T cells were transfected with the indicated plasmids for 36 h, the accumulation of autophagosomes and autolysosomes was analyzed via TEM. Red, autophagosomes; yellow, autolysosomes. Quantitative analysis of LC3-II:LC3-I ratios was performed with Image J software. The average value in Ctrl-transfected cells was normalized to 1 in the immunoblotting quantitative calculations. The number of EGFP-LC3+ dots in each cell was counted with Image J software, and at least twenty cells were included for each group. The scale bars are all 10 μm. Data are presented as the mean ± SEM from at least three independent experiments (*p < 0.05, **p < 0.01, ***p < 0.001, and ****p < 0.0001).
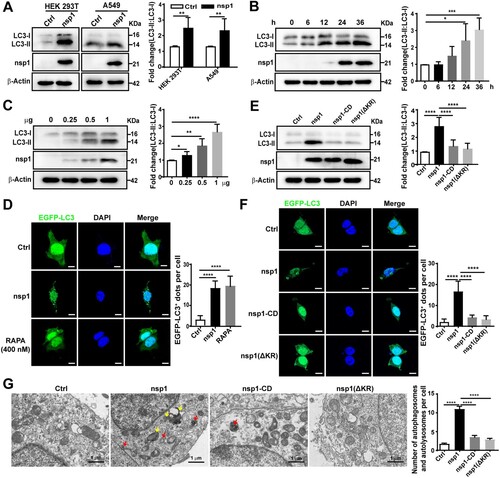
Figure 2. nsp1 induces autophagy but inhibits autophagic flux. HEK 293 T cells were transfected with the indicated plasmids for 30 h, then treated with BafA1 (A) or HCQ (B) for 6 h. Cell lysates were analyzed by immunoblotting. (C) HEK 293T cells were co-transfected with mCherry-EGFP-LC3 and the indicated plasmids for 36 h. Meanwhile, HEK 293T cells transfected with mCherry-EGFP-LC3 for 30 h and then treated with RAPA or BafA1 for 6 h, which were used as the controls for autophagy induction and the inhibition of autolysosome maturation, respectively. Autophagosomes (mCherry+EGFP+) and autolysosomes (mCherry+EGFP-) were analyzed by confocal microscopy. (D) HEK 293 T cells were co-transfected with mCherry-LC3 and indicated plasmids for 36 h, the co-localization of LAMP1 and mCherry-LC3 was analyzed by confocal microscopy. Quantitative analyses of LC3-II:LC3-I and p62: β-Actin were performed with Image J software. The average value in Ctrl cells was normalized to 1 in the immunoblotting quantitative calculations. The number of autophagosomes and autolysosomes in each cell was counted with Image J software, and at least twenty cells were included in each group. The scale bars are all 10 μm. Data are presented as the mean ± SEM from at least three independent experiments (*p < 0.05, **p < 0.01, and ****p < 0.0001).
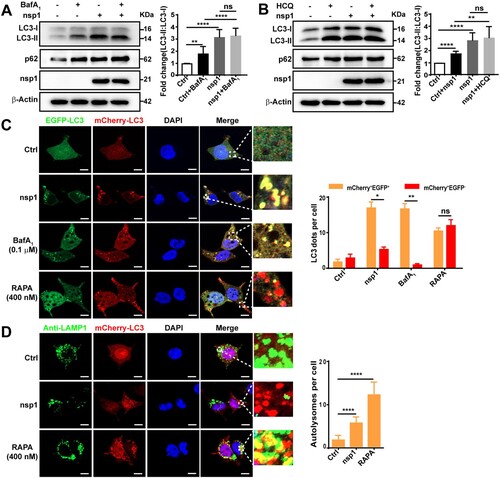
Figure 3. nsp1 induces autophagy through the AMPK-mTOR signalling pathway. (A) HEK 293 T cells were transfected with the indicated plasmids for 36 h, and cell lysates were analyzed by immunoblotting. (B and C) HEK 293 T cells were pretreated with CC for 2 h and then transfected with the indicated plasmids for another 36 h, cell lysates were evaluated by immunoblotting (B), and EGFP-LC3+ dots were observed by confocal microscopy (C). (D) HEK 293 T cells were transfected with the indicated plasmids for 36 h, after which the ATP levels were measured using a luminescence assay system. (E) HEK 293 T cells were transfected with the indicated plasmids for 36 h, and the intracellular ROS levels were examined by DCFH-DA assay. (F) and (G) HEK 293 T cells were transfected with the indicated plasmids for 36 h in the absence or presence of NAC; cell lysates were analyzed by immunoblotting (F), and EGFP-LC3+ dots were visualized by confocal microscopy (G). The number of EGFP-LC3+ dots in each cell was counted with Image J software, and at least twenty cells were included for each group. The scale bars are all 10 μm. Data are presented as the mean ± SEM from at least three independent experiments (*p < 0.05, **p < 0.01, ***p < 0.001, and ****p < 0.0001).
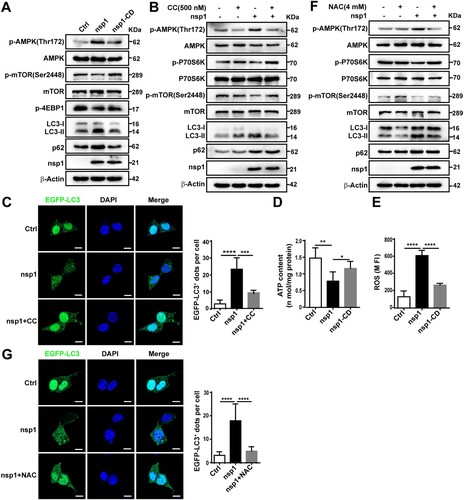
Figure 4. nsp1 impairs lysosomal biogenesis and acidification. (A) Heat map of downregulated lysosome-related genes by nsp1. (B) HEK 293 T cells were transfected with the indicated plasmids for 24 h, and the transcription levels of the indicated genes were analyzed by RT-qPCR. (C) HEK 293 T cells were transfected with the indicated plasmids for 36 h, then fixed and immunostained by an anti-LAMP1 antibody, and further analyzed by confocal microscopy. (D) HEK 293 T cells were transfected with the indicated plasmids for 36 h, and cell lysates were analyzed by immunoblotting. (E) HEK 293 T cells were transfected with the indicated plasmids for 36 h, then treated with EGF (40 ng/mL) for 0, 60, and 120 min; EGF-induced EGFR degradation was analyzed by immunoblotting. (F) HEK 293 T cells were transfected with the indicated plasmids for 36 h and then treated with Lyso-Tracker for 40 min and analyzed by confocal microscopy. (G) HEK 293 T cells were transfected with the indicated plasmids for 36 h, and the co-localization of LAMP1 and Lyso-Tracker was analyzed by confocal microscopy. (H) HEK 293 T cells were transfected with the indicated plasmids for 36 h, after which active cathepsin B was detected by Magic Red dye. The number of LAMP1+, Lyso-Tracker+, and Magic Red dots in each cell were counted with Image J software, and at least twenty cells were included for each group. The scale bars are all 10 μm. Data are presented as the mean ± SEM from at least three independent experiments (**p < 0.01, ***p < 0.001, and ****p < 0.001).
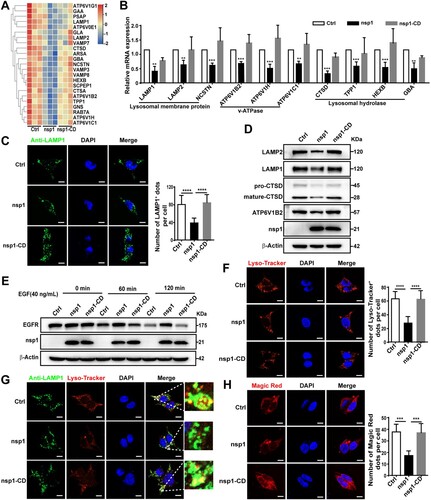
Figure 5. nsp1 inhibits lysosomal biogenesis and acidification through its endonuclease activity. (A) HEK 293 T cells were transfected with the indicated plasmids for 12 h, and then these cells were incubated in the absence or presence of Act D (2 μg/mL) for 24 h; mRNA levels of the indicated genes were analyzed by RT-qPCR. (B) Indicated plasmids were transfected into Scramble- or sh-XRN1-treated HEK293T cells; after 36 h, the mRNA levels of the indicated genes were analyzed by RT-qPCR. (C) HEK293T cells were transfected with the indicated plasmids for 36 h; the mRNAs that nsp1 directly bound to were detected by RIP-qPCR. (D) HEK 293 T cells were transfected with the indicated plasmids for 36 h, and the co-localization of LAMP1 mRNA and nsp1 was analyzed by RNA-FISH. Scale bar: 10 μm. Data are presented as the mean ± SEM from at least three independent experiments (*p < 0.05, **p < 0.01, ***p < 0.001, and ****p < 0.001).
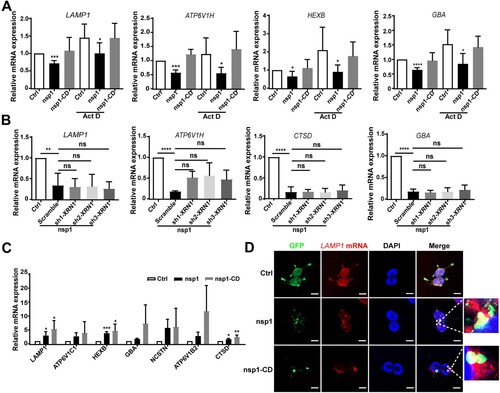
Figure 6. nsp1-induced autophagy impairs cell viability. (A) HEK 293 T cells were transfected with the indicated plasmids in the presence or absence of 3-MA, Z-VAD, Nec-1, and Fer-1 for 36 h; the cell viability was determined by CCK8 assay. (B) The indicated plasmids were transfected into Scramble- or ATG5/BECN1-knockdown HEK 293 T cells. After 36 h, the cell viability was determined by CCK8 assay. (C) HEK 293 T cells were transfected with the indicated plasmids in the presence or absence of 3-MA, and the apoptosis rate was determined by flow cytometry. The indicated plasmids were transfected into Scramble- or (D) ATG5/(E) BECN1-knockdown HEK293T cells for 36 h, and the apoptosis rate was determined by flow cytometry. Data are presented as the mean ± SEM from at least three independent experiments (*p < 0.05, **p < 0.01, ***p < 0.001, and ****p < 0.001).
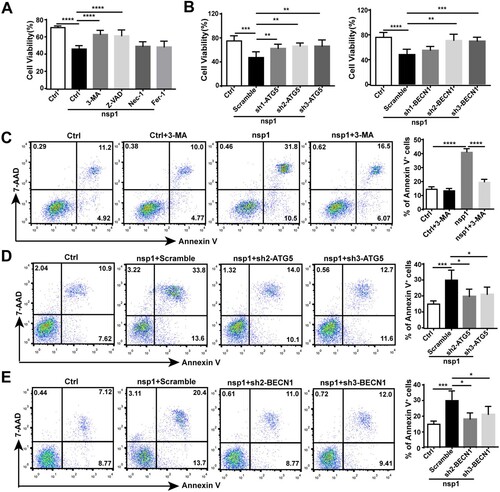
Figure 7. nsp1 induces autophagy in a transgenic mouse model. MEFs were prepared from day 15–18 embryos, and genotype identification was performed. (A) The design strategy of tetracycline-induced nsp1 transgenic mice. (B) MEFs were induced with or without DOX for 3 days, and cell lysates were analyzed by immunoblotting. (C) MEFs were pretreated with or without DOX for 3 days, and cells were fixed and immunostained for LC3. (D) MEFs were fixed and immunostained for LC3 and LAMP2 after DOX induction for 3 days. The co-localization of LAMP2 and LC3 was analyzed by confocal microscopy. (E) Representative images of HE staining analysis and immunohistochemistry staining of p62 in lung tissue. (F) Immunoblotting showed LC3 and p62 levels in the lung tissue. Quantitative analysis of LC3-II:LC3-I ratios was performed with Image J software. The average value in WT was normalized to 1 in the immunoblotting quantitative calculations. LC3+ dots in each cell were quantified by Image J software, and at least twenty cells were included for each group. The scale bars are all 10 μm. Data are presented as the mean ± SEM from at least three independent experiments (****p < 0.001).
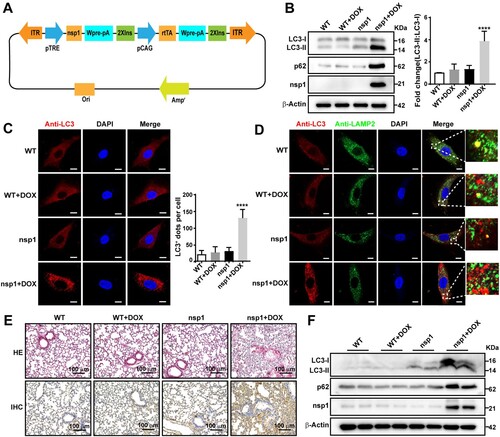
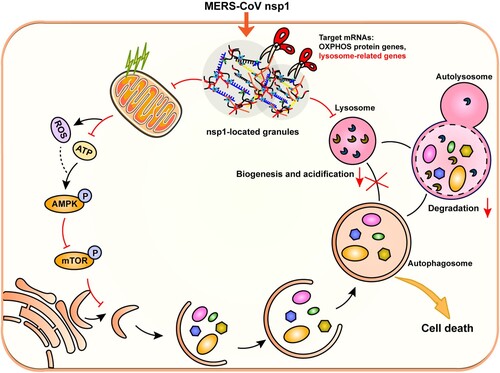
Figure 8. Schematic diagram of the proposed mechanisms involved in nsp1-induced autophagy. nsp1-located granules were rich in RNA-binding proteins and the mRNAs of OXPHOS protein genes and lysosome-related genes. As an endonuclease, nsp1 cleaved the mRNA of OXPHOS protein genes, which disturbed mitochondrial function. The increased ROS and decreased ATP led to the activation of AMPK and the inhibition of mTOR activity, thereby triggering autophagy. On the other hand, nsp1 directly bound to and downregulated the mRNA of lysosome-related genes, blocking the autophagic flux by impairing autophagosome-lysosome fusion and the degradation of autolysosomes. In turn, nsp1-induced autophagy led to cell death.
Supplemental Material
Download Zip (11.6 MB)Data availability
The authors confirm that the data supporting the findings of this study are available within the article and its supplementary materials