Figures & data
Figure 1. Spectrum of COVID-19 and primary outcomes.
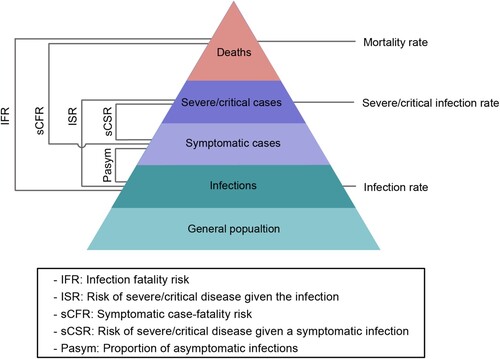
Figure 2. Infection rate, severe/critical infection rate and mortality rate of COVID-19 caused by SARS-CoV-2 Omicron in Shanghai A) Infection rate (per 100 individuals); B) Severe/critical infection rate (per 100,000 individuals); C) Mortality rate (per 100,000 individuals).
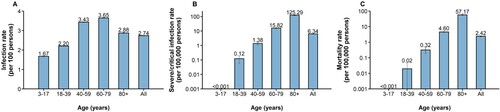
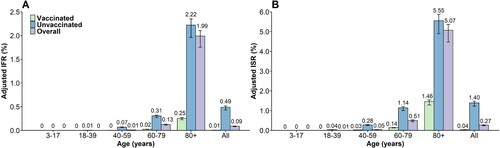
Figure 3. Adjusted IFR and ISR of COVID-19 caused by SARS-CoV-2 Omicron in Shanghai A) IFR; B) ISR. The number represents the median estimates, and the error bar represents the 95% confidence interval.