Figures & data
Figure 1. The interaction between S protein and ACE2 was studied by SMFS. (A) Schematic diagram of SARS-COV-2 particle, an enveloped ssRNA virus expressing spike glycoprotein (S) on its surface. (B) Crystal structure of Delta variant (B.1.617.2) in complex with three ACE2. S is divided into N-terminal S1 and C-terminal S2 domains. RBD, binding with ACE2, was located at the C-terminal of the S1 sub-domain. (C) Schematic of measurement of adhesive interaction between S protein and ACE2 using SMFS. The purified S protein and ACE2 were attached to probe and substrate, respectively. (D) A representative force-extension curve showing specific adhesive event labelled by star. (E) The adhesive forces between S proteins from different variants and ACE2. (F) Pulling speed dependency of adhesive forces and Monte Carlo simulations for extracting the kinetic parameter. Solid dots represent experimental data and dotted lines represent simulated results.
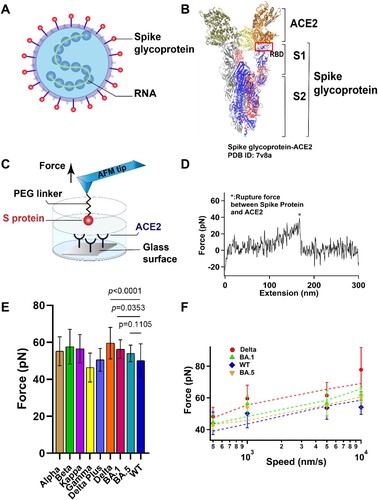
Table 1. Kinetics extracted from dynamic force spectroscopy experiments.
Figure 2. Experimental results of SCFS. (A) Schematic of SCFS experiments. (B) A representative force-extension curve of the detachment of Vero cell from S protein coated surface. (C) Adhesion force between cells and S proteins from different variants.
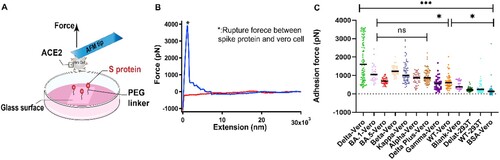
Figure 3. Anti-binding effects of mAb on S protein binding. (A) Efficiency of mAb is evaluated by measuring the BP of the interaction between the S proteins and ACE2 on model surface before and after incubation of the mAb. (B) Force-extension cures showing either nonadhesive and specific adhesive curves on model surface. (C) Histograms of binding probabilities (BP) between purified ACE2 and S proteins (WT, Delta and Omicron (BA.1 and BA.5)). (D) Efficiency of mAb is evaluated at the cellular level. (E) Force-extension cures measured on Vero cells. (F) Histograms of binding probabilities (BP) between Vero cells and S proteins (WT, Delta and Omicron (BA.1 and BA.5)). Experiments with isotype control antibody IgG1 and without addition of mAb were designed as control.
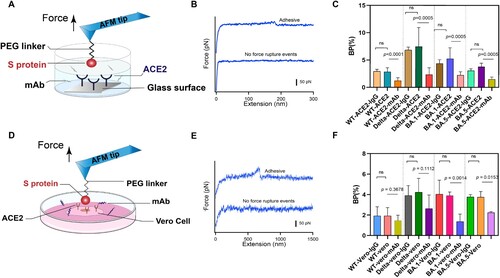
Figure 4. MD simulations of ACE2-RBD complex. (A and B): The interactive interface of ACE2 (yellow) and RBD from Delta (A, green) and Omicron (B, red) variants. (C): Interaction Energy of ACE2 and the individuals of 477, 484, 501 and 505 amino acid residues on RBD from Delta (green) and Omicron (red) Variants.
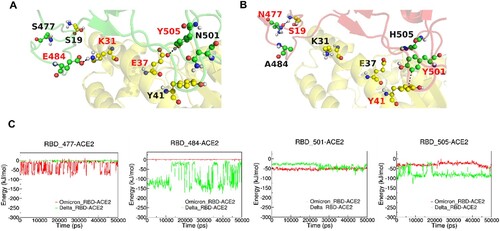
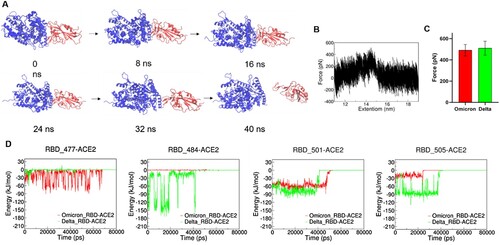
Figure 5. SMD simulation of RBD and ACE complex. (A) Schematics of pulling RBD away from ACE2. (B) Representative force-extension curve of pulling RBD away from ACE2. (C) Unbinding forces of ACE2 and RBD from Delta and Omicron variants. (D) Interaction energy between ACE2 and individual amino acid residues on RBD.