
Figures & data
Figure 1. Population structure and the phylogenetic context of E. anophelis. Maximum likelihood tree based on single nucleotide polymorphisms of the 318 global isolates mapped against the reference strain E. anophelis CSID_3015183678. Primary clusters 1–4 are indicated in the inner coloured ring; branches defining these groups are coloured in the tree, and these groups are then divided into subclades. Coloured rings from the inside out indicate clusters, clinical or environmental isolates, country of origin, sample type and data sources, respectively. These rings are further divided into different colour combinations, representing a concrete definition. The black dots represent the bootstrap values. Origin: clinical or environmental isolates; Region: the country where the strain was isolated; Source: sample source of strain; BAL: bronchoalveolar fluid; CSF: cerebrospinal fluid.
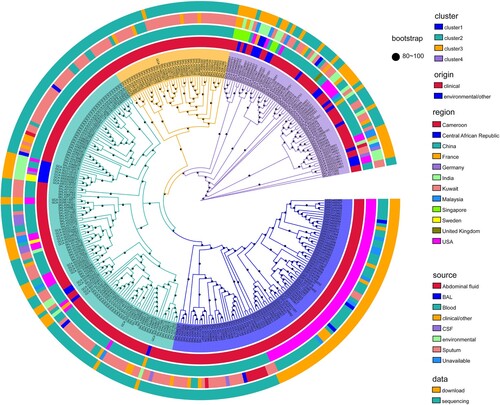
Figure 2. Geographical distribution and admixture of E. anophelis populations. Map of the world showed the subclade diversity existing of E. anophelis isolates in the global collection. Each circle indicates the population composition of a city/country, with a radius in proportion to the sample size. Pies are sized to indicate the number of isolates; slices are coloured by clusters. The clusters shared with the aforementioned result of clade membership of . An interactive version of the global phylogeny, with organisms labelled by genotype, country of origin, and year of isolation, is available at https://microreact.org/project/r2egrptGKuEdK9mcZcCe5v.
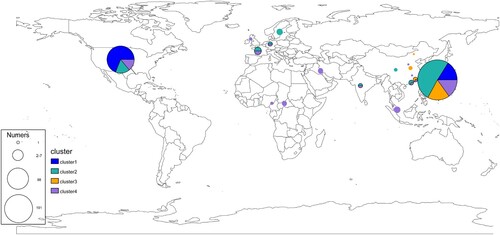
Figure 3. Distribution of Integrative and Conjugative Elements (ICEs) in E. anophelis strains isolated from around the world. The left-hand black columns represent the sample names of all isolates identified ICE. The coloured columns from left to right represent sample collected date (year), clinical or environmental isolates, country of origin, sample sources and ICE types, respectively. Type I: ICEEaI; Type II: ICEEaII; Type III: ICEEaIII. Different meaning of different colours in each concerned column has been detailedly interpreted on the rightmost.
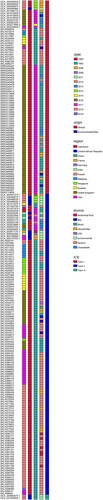
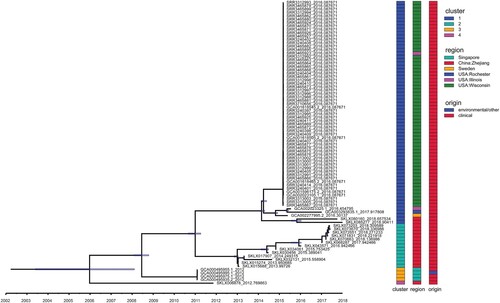
Figure 4. Temporal analysis on ICEEaI E. anophelis using BEAST (n = 84 isolates). Light blue horizontal bars centred on nodes indicate 95% highest probability density (HPD) values. (Right) Three different coloured bars denote cluster, origin and region respectively of these isolates. Clusters 1–4 are corresponding to . Origin means clinical or environmental strains. Region indicates the country and place where the strain was isolated. Time bar (year) is shown at the bottom.
Supplemental Material
Download Zip (1.7 MB)Data availability
Accession numbers for all genome data included in this work are summarized in Supplementary Table 1. Every genome sequence assembled for the 197 newly sequenced E. anophelis isolates has been deposited in the NCBI, associated with project ID PRJNA643387. The software for the Microreact interactive tree viewer is available at: https://microreact.org/project/r2egrptGKuEdK9mcZcCe5v. Python script to visualize and annotate trees is available at https://github.com/katholt/plotTree/#python-code.