
Figures & data
Table 1. Baseline characteristics.
Figure 1. Ten most common symptoms of long COVID at two years.
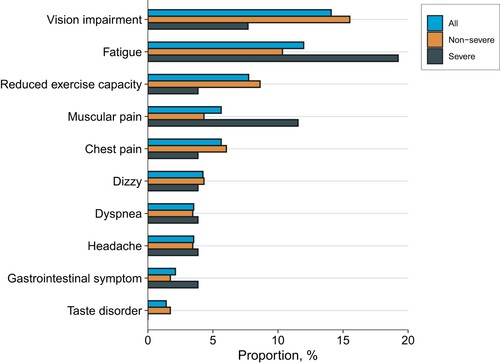
Table 2. Healthy outcomes in patients at 2 years after the infection.
Figure 2. Changes in (A) CT abnormality and (B) CT severity scores over time. The kinetics of CT severity scores at consecutive time points were investigated using Friedman's test (grouping by individual). The Kendall’s W was used as the measure of the Friedman test effect size. The paired Wilcoxon test was used for comparing differences between two consecutive time points. Plots show individual score trajectories as thin grey lines, red lines represent means, and coloured areas represent mean ± standard deviation. The figure shows the number of individuals who completed a series of consecutive CT scans in 74 cases.
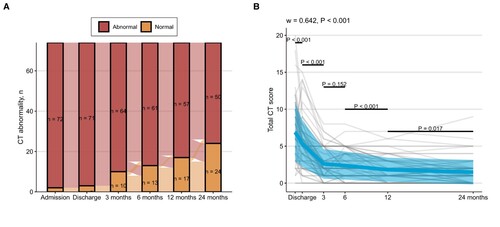
Table 3. The distribution of parameters in kidney and liver function at two years after infection