
Figures & data
Figure 1. Evolution experiment and phenotypic characterization. (A) Pathogen–host cell co-culture-based laboratory evolution experiment. (B) Representative images of the morphological diversity of A. baumannii populations adapted to pulmonary epithelial cells (A549 and HBE). (C) Representative Congo red-stained images of capsules of colonies (ASD9/ACD9/HSD9/HCD9) derived from evolved strains. Scale bar, 10 μm (D) OD600 values of culture supernatants. (E) Biofilm formation is revealed by crystal violet staining. (F) Adherence to epithelial cells and internalization by macrophages. Data are from at least three independent experiments; error bars represent standard deviations. **P < 0.01 vs. blank group, ##P < 0.01, #P < 0.05.
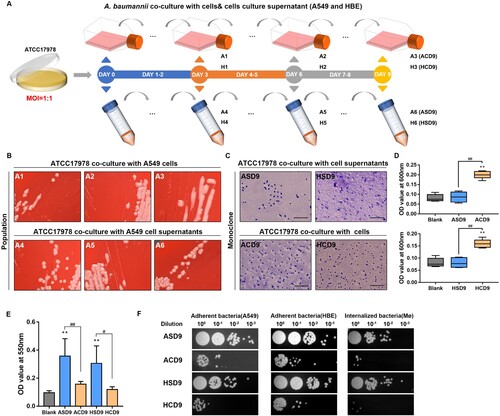
Table 1. Antimicrobial susceptibility of ATCC17978 and in vitro evolved strains
Table 2. Mutations acquired by evolved clones identified through whole genome re-sequencing (WGS).
Figure 2. ptk mutation induces the mucoid phenotype and reduces adhesion and internalization. (A) Representative images of morphological diversity of ATCC17978 and its mutant strains (ptk V653E, rsmGΔT, rsmG(TTG)2→3, and rnaseIΔA). (B) Adherence to epithelial cells and internalization by macrophages of ATCC17978 and its mutant strains. (C) OD600 values of culture supernatants of ATCC17978 and its mutant strains. (D) Biofilm formation by ATCC17978 and its mutant strains as revealed by crystal violet staining. (E) Representative images of morphological diversity of the evolved and ptk-WT complemented strains. (F) Representative Congo red-stained images of the capsules of evolved strains and ptk-WT complemented strains. Scale bar, 10 μm. (G) Adherence to epithelial cells and internalization by macrophages of evolved strains and ptk-WT complemented strains. (H) Capsular exopolysaccharide stained with Alcian blue (sup supernatant, arrows HMW exopolysaccharides). (I–K) IL-6, IL-8, and TNF-α mRNA levels in A549 cells (I), HBE cells (J), and THP-1 derived macrophages (K) at 3 h after infection. **P < 0.01 vs. ATCC17978 group.
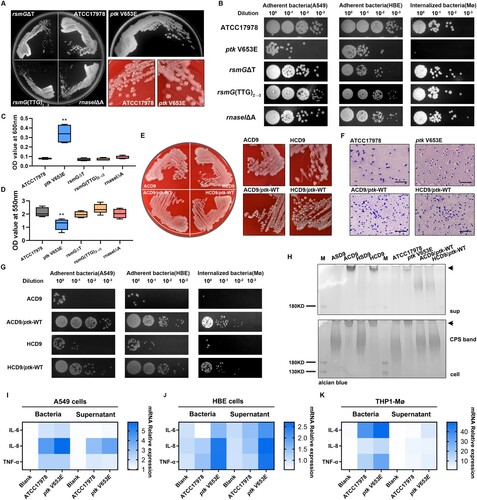
Figure 3. m7G524 deficiency caused by rsmG mutation increases ribosomal translation efficiency. (A) Prediction of m7G modification site in rsmG mutant strains by third-generation sequencing. (B) RsmG mediated m7G modification of nucleotide 524 in the 16S rRNA of A. baumannii. (C) In vitro methyltransferase activity using 16S rRNA probes and RsmG protein, with detection of m7G and G by LC-MS/MS. (D and E) m7G/G ratio. (F–H) 70S ribosome activity of rsmG mutant (F) and complemented strains (G and H) by in vitro translation assay. **P < 0.01 vs. RsmG-WT (Probe 1, ATCC17978, rsmGΔT/pYMAb2 or rsmG(TTG)2→3/pYMAb2) groups, ##P < 0.01.
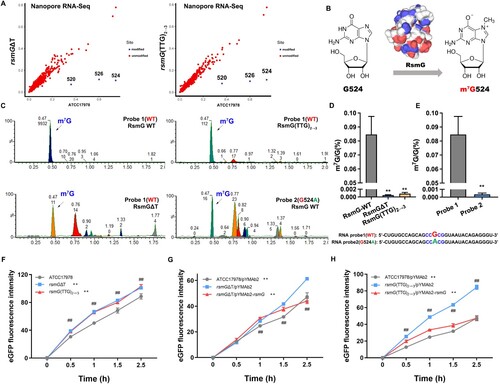
Figure 4. rnaseI mutation affects outer membrane permeability and efflux pump expression. (A) Heatmap of RND efflux transporter gene expression. (B) Heatmap of outer membrane formation gene expression. (C and D) mRNA stability of RND efflux transporter-related genes (C) and outer membrane protein/lipoprotein synthesis-related genes (D) in rnaseIΔA compared to ATCC17978. (E) Representative images of the morphology of the evolved and rnaseI WT/ΔA strains by scanning electron microscopy (SEM). (F and G) Outer membrane permeability was measured via flow cytometry – the percentage of TO-PRO-3 positive cells (F) and adjusted fluorescence intensity (G). **P < 0.01, *P < 0.05 vs. ATCC17978 or ASD9 group, ##P < 0.01, #P < 0.05.
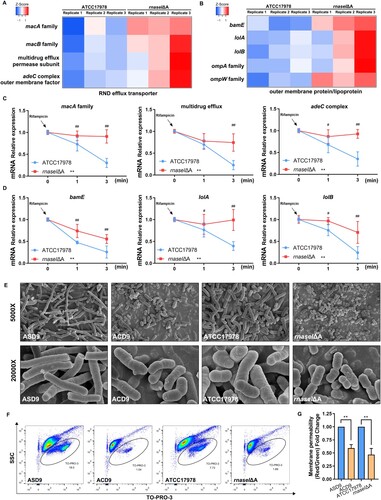
Figure 5. rsmG and rnaseI mutations impair bacterial iron acquisition and utilization. (A) Siderophore and siderophore receptor gene expression data in rsmG and rnaseI mutants. (B–G) Growth curves of the mutants (B–D) and their complemented strains (E–G) in the presence or absence of the ferrous iron chelator 2,2′-dipyridyl (DIP). (H–K) Areas under the growth curves (AUC) of the mutants (H) and their complemented (I–K) strains in the presence or absence of DIP. **P < 0.01, *P < 0.05 vs. ATCC17978 or ATCC17978/pYMAb2 group, ##P < 0.01, #P < 0.05.
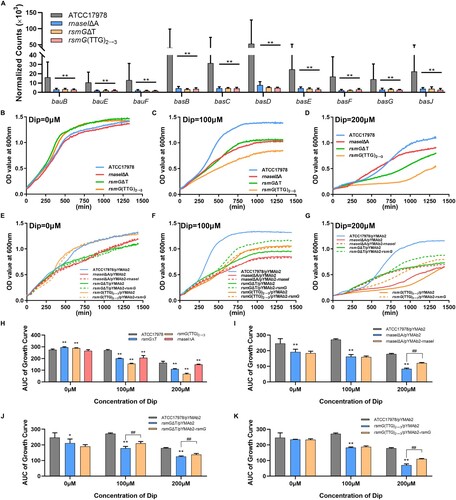
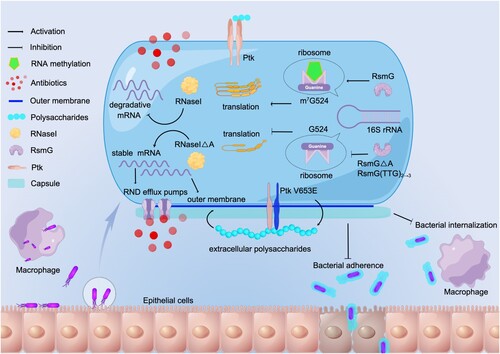
Figure 6. Proposed mechanism of A. baumannii pathoadaptation to epithelial cells. In A. baumannii, mutation of ptk mediates mucoid conversion and reduces adhesion and internalization. Mutations of rsmG and rnaseI involve in antibiotic resistance, and m7G524 deficiency in 16S rRNA caused by rsmG mutation increases ribosomal translation efficiency and may act as global regulators, and rnaseI mutation affects outer membrane permeability and efflux pump expression by modulating RNA metabolism. (By Figdraw, www.figdraw.com).
Supplemental Material
Download MS Word (927.8 KB)Data availability
The complete genome sequences of the evolved strains (ACD9 and HCD9) were deposited in NCBI under BioProject No. PRJNA867505. The RNA-seq data of A. baumannii ATCC17978, rnase I, and rsmG mutants were deposited in NCBI under BioProject No. PRJNA867119. The direct RNA-seq (ONT) data of A. baumannii rsmG WT/mutants were deposited in NCBI under BioProject No. PRJNA882509.