
Figures & data
Figure 1. Characteristics of human mAbs contacting L452 in SARS-CoV-2 spike. (A) Pie chart showing the proportion of mAbs contacting L452 within the PDB. (B) Pie chart showing the germline distribution of 221 RBD-targeting mAbs (left panel) and 69 mAbs that contact with L452 (right panel). (C) Pie chart showing the proportion of mAbs that contact with L452 among IGHV1-69, IGHV1-2, IGHV3-30, IGHV3-11, or other IGHVs-encoded RBD-specific mAbs that are deposited in the PDB. (D) IGHV germline gene usage by RBD-targeting mAbs compared to antibody repertoires of healthy individuals. Histogram represents the IGHV germline gene usage of RBD-targeting mAbs, black lines represent the IGHV germline gene usage in antibody repertoires of healthy individuals [Citation10,Citation13,Citation14]. (E) Heatmap showing the occurrences of L452-contacting mAbs in blood samples collected at different timepoints of 33 COVID-19 convalescents [Citation10,Citation13,Citation14]. The top annotation represents the sample collection time (Dpo: Days post symptom onset). The left annotation represents germline IGHV genes of L452-contacting mAbs. Colour bar represents the abundance of IgH sequences that related to L452-contacting mAbs.
![Figure 1. Characteristics of human mAbs contacting L452 in SARS-CoV-2 spike. (A) Pie chart showing the proportion of mAbs contacting L452 within the PDB. (B) Pie chart showing the germline distribution of 221 RBD-targeting mAbs (left panel) and 69 mAbs that contact with L452 (right panel). (C) Pie chart showing the proportion of mAbs that contact with L452 among IGHV1-69, IGHV1-2, IGHV3-30, IGHV3-11, or other IGHVs-encoded RBD-specific mAbs that are deposited in the PDB. (D) IGHV germline gene usage by RBD-targeting mAbs compared to antibody repertoires of healthy individuals. Histogram represents the IGHV germline gene usage of RBD-targeting mAbs, black lines represent the IGHV germline gene usage in antibody repertoires of healthy individuals [Citation10,Citation13,Citation14]. (E) Heatmap showing the occurrences of L452-contacting mAbs in blood samples collected at different timepoints of 33 COVID-19 convalescents [Citation10,Citation13,Citation14]. The top annotation represents the sample collection time (Dpo: Days post symptom onset). The left annotation represents germline IGHV genes of L452-contacting mAbs. Colour bar represents the abundance of IgH sequences that related to L452-contacting mAbs.](/cms/asset/47cca1b0-c9ad-41cc-80d5-e47e37e147ea/temi_a_2140611_f0001_oc.jpg)
Figure 2. Structural analysis of the L452-contacting mAbs. (A) Histogram showing the buried surface area (BSA) at L452 by L452-contacting mAbs. (B) Comparison of buried surface areas at L452 among IGHV1-69, IGHV1-2, IGHV3-30, IGHV3-11, and other IGHVs-encoded L452-contacting mAbs. ****p<0.0001, ***p<0.001, **p<0.01, *p<0.05 by unpaired t test. (C). Binding mode comparison of L452-contacting mAbs encoded by IGHV1-69, IGHV1-2, IGHV3-30, IGHV3-11, and other IGHV genes. The residues involved in the interactions are shown as sticks. Residues in the RBD are coloured in grey, and residues in antibody heavy chain and light chains are coloured in magenta and cyan, respectively.
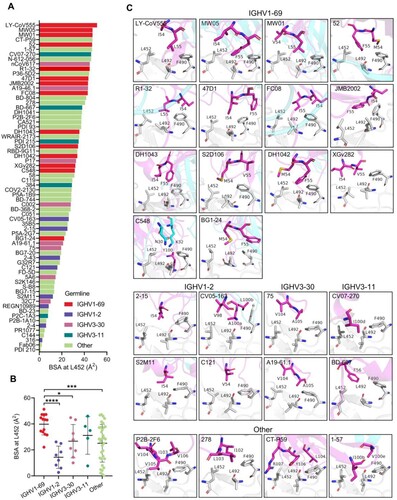
Figure 3. Binding and neutralization activities of IGHV1-69-encoded L452-contacting mAbs. (A) Binding abilities of IGHV1-69-encoded mAbs to wildtype (WT) or L452R RBDs were assessed by BLI. (B) Comparison of binding abilities of IGHV1-69-encoded mAbs to WT and L452R RBDs. The y-axis represents equilibrium dissociation constant (KD). (C) Neutralizing activities of IGHV1-69-encoded mAbs to WT or B.1.617.2 (Delta) viruses were measured by FRNT. (D) Comparison of the neutralizing abilities of IGHV1-69-encoded mAbs to WT and B.1.617.2 (Delta) authentic viruses. The y-axis represents half maximal inhibitory concentration (IC50). (E) IC50 values of the IGHV1-69-encoded L452-contacting mAbs against WT or B.1.617.2 (Delta) viruses. green, IC50 ≤ 100 ng/mL; blue, 100 ng/mL < IC50 < 1,000 ng/mL; red, IC50 ≥ 1,000 ng/mL; *, IC50 ≥ 5,000 ng/mL. Statistical tests in panel B and D are performed using two-tailed Wilcoxon signed-rank tests of paired samples. *, p < 0.05; **, p < 0.01, p < 0.001, ***.
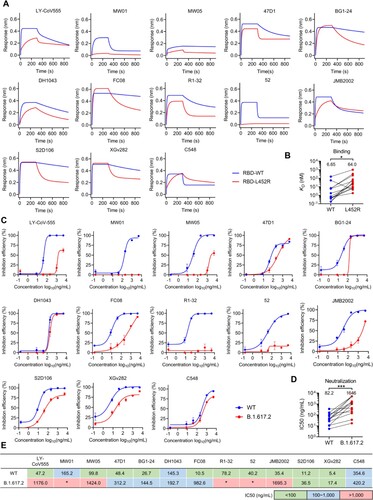
Figure 4. Characteristics and prevalence of IGHV1-69-encoded L452-contacting mAbs among antibodies isolated from vaccinees, Delta or Omicron breakthrough infected individuals. (A) Comparison of IGHV germline gene usage of RBD-targeting mAbs in among antibodies isolated from vaccinees, Delta breakthrough infected, and Omicron breakthrough infected individuals. Black lines represent the IGHV germline gene usage in antibody repertoires of healthy individuals [Citation10,Citation13,Citation14]. (B) Binding mode of L452-contacting mAbs Omi-2 and Omi-31. The residues involved in the interactions are shown as sticks. Residues in the RBD are coloured in grey, and residues in antibody heavy chain and light chains are coloured in magenta and cyan, respectively. (C) Summary of the R1-32-like mAbs isolated from individuals with SARS-CoV-2 primary infections, or receiving inactivated or mRNA vaccines, or with Omicron breakthrough infections [Citation16, Citation19, Citation20, Citation21, Citation22, Citation23]. (D) Fold-change of the binding affinities of R1-32-like mAbs to Delta RBD relative to WT RBD. (E) Binding abilities of five IGHV1-69-encoded L452-contacting mAbs to WT, E484K, E484Q, and E484A RBDs as measured by ELISA.
![Figure 4. Characteristics and prevalence of IGHV1-69-encoded L452-contacting mAbs among antibodies isolated from vaccinees, Delta or Omicron breakthrough infected individuals. (A) Comparison of IGHV germline gene usage of RBD-targeting mAbs in among antibodies isolated from vaccinees, Delta breakthrough infected, and Omicron breakthrough infected individuals. Black lines represent the IGHV germline gene usage in antibody repertoires of healthy individuals [Citation10,Citation13,Citation14]. (B) Binding mode of L452-contacting mAbs Omi-2 and Omi-31. The residues involved in the interactions are shown as sticks. Residues in the RBD are coloured in grey, and residues in antibody heavy chain and light chains are coloured in magenta and cyan, respectively. (C) Summary of the R1-32-like mAbs isolated from individuals with SARS-CoV-2 primary infections, or receiving inactivated or mRNA vaccines, or with Omicron breakthrough infections [Citation16, Citation19, Citation20, Citation21, Citation22, Citation23]. (D) Fold-change of the binding affinities of R1-32-like mAbs to Delta RBD relative to WT RBD. (E) Binding abilities of five IGHV1-69-encoded L452-contacting mAbs to WT, E484K, E484Q, and E484A RBDs as measured by ELISA.](/cms/asset/6304c8b1-68d5-4f38-a7c1-7cefc0608c4d/temi_a_2140611_f0004_oc.jpg)