
Figures & data
Table 1. Socio-demographic characteristics of HIV patients in Guangxi, 2017–2018.
Figure 1. HIV Transmission network in Guangxi. Nodes indicate HIV patients or sequences. The size of a node is proportional to its degree. Edges (i.e. links) represent genetic linkage (≤0.018 substitutions/site). Colours indicate different age groups in (a) and HIV subtypes in (b). Shapes indicate gender in (a) and different transmission routes in (b). Other genotypes include subtype B, C, G, CRF55_01B and unique recombinant form. Other transmission routes include mem who have sex with men (MSM), blood transmission (BLD), and unknown.
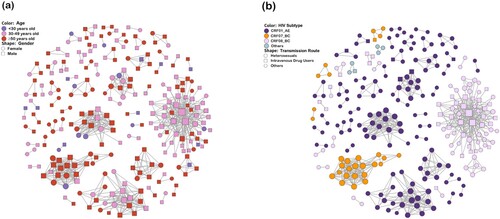
Figure 2. Large transmission clusters. Nodes indicate patients or sequences. The size of a node is proportional to its degree. Edges (i.e. links) represent genetic linkage (≤0.018 substitutions/site). Colours indicate different age groups. Shapes indicate different transmission routes. Nodes with degree ≥15 (i.e. individuals at high risk of HIV transmission) are circled with black dashed lines and indicated by black arrows, except for one node in cluster five with degree = 10.
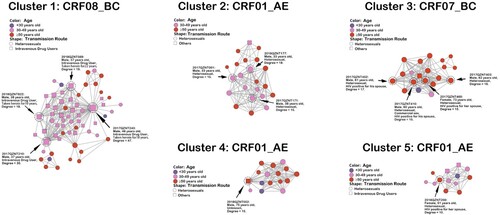
Figure 3. Transmission clusters containing RHI. Nodes indicate patients or sequences. The size of a node is proportional to its degree. Edges (i.e. links) represent genetic linkage (≤0.018 substitutions/site). Colours indicate different age groups. Shapes indicate HIV infection status. Recently infected individuals are circled with black dashed lines and indicated by black arrows. Clusters are arranged by different HIV subtypes. Abbreviations: CRF, circulating recombinant form; CHI, chronic HIV infection; RHI, recent HIV infection.
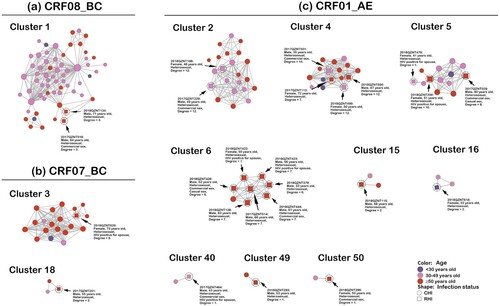
Figure 4. HIV migration events. Well-supported virus dispersal events among age-gender subgroups of (a) CRF01_AE, (b) CRF08_BC, and (c) CRF07_BC. Only results with a Bayes factor (BF) ≥ 3 and posterior probability support ≥0.9 are presented. Arrows indicate the direction of HIV migration events. The colours were chosen to visually distinguish the different level of BF values. Abbreviations: OF, older female; OM, older male; YF, younger female; YM, younger male.
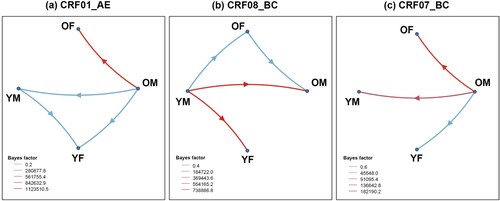
Table 2. Factors associated with clustering among HIV patients in Guangxi, 2017–2018.
Table 3. Factors associated with high linkage (i.e. degree ≥7) among clustered individuals within networks.
Table 4. Differences between RHI and CHI patients among clustered individuals within networks