
Figures & data
Figure 1. Study design. Peripheral blood mononuclear cells (PBMCs) and plasma were collected from healthy controls (HCs), treatmentnaïve individuals (TNs), immunological responders (IRs), and immunological non-responders (INRs). Flow cytometry was used to evaluate T cell dysfunction, including T cell exhaustion, activation, and differentiation. The O-link inflammatory panel was used to measure 92 inflammation-related proteins (IRPs). The clinical parameters of the enrolled participants were also obtained. The association between IRPs and HIV-1 clinical parameters and T cell dysregulation were analyzed.

Table 1. Clinical characteristics of study subjects.
Figure 2. T cell subsets in HIV-1-infected individuals. CD45RA, CD27, and CCR7 expression in peripheral blood mononuclear cells (PBMCs) was determined using flow cytometry. T cell subsets were defined as follows: naïve (TN; CD45RA+ CD27+ CCR7+), central memory (TCM; CD45RA− CD27+ CCR7+), transitional memory (TTM; CD45RA− CD27+ CCR7−), effector memory (TEM; CD45RA− CD27− CCR7−), and terminal differentiated/effector (TTD/TE; CD45RA+ CD27+ CCR7−). (A) Uniform manifold approximation and projection (UMAP) analysis of T cell subsets in healthy controls (HCs), treatment-naïve individuals (TNs), immunological responders (IRs), and immunological non-responders (INRs). Each point on the high-dimensional mapping represents an individual cell, and the UMAP plots show the cell populations in different colours. (B–C) Proportions of (B) CD4 and (C) CD8 T cell subsets in HCs (n = 20), TNs (n = 23), IRs (n = 33), and INRs (n = 38). Data are expressed as the median (interquartile range, IQR). Each dot represents a participant. Statistical significance between two groups was determined using non-parametric unpaired Mann–Whitney U test. *P < 0.05, **P < 0.01, ***P < 0.001, ****P < 0.0001.

Figure 3. Altered inflammation-related proteins in plasma from HIV-1-infected individuals. (A) t-Distributed stochastic neighbour embedding visualization of individuals with different categories based on inflammation-related proteins (IRPs) in plasma detected using the Olink platform. (B) Venn diagram showing the number of differentially expressed IRPs in different combinations [treatment-naïve individuals (TNs) vs. healthy controls (HCs), immunological responders (IRs) vs. HCs, immunological non-responders (INRs) vs. HCs]. (C) Heatmap of differentially expressed IRPs.
![Figure 3. Altered inflammation-related proteins in plasma from HIV-1-infected individuals. (A) t-Distributed stochastic neighbour embedding visualization of individuals with different categories based on inflammation-related proteins (IRPs) in plasma detected using the Olink platform. (B) Venn diagram showing the number of differentially expressed IRPs in different combinations [treatment-naïve individuals (TNs) vs. healthy controls (HCs), immunological responders (IRs) vs. HCs, immunological non-responders (INRs) vs. HCs]. (C) Heatmap of differentially expressed IRPs.](/cms/asset/6e18956a-d071-42b3-ab0b-541d828aac07/temi_a_2150566_f0003_oc.jpg)
Figure 4. Association between inflammation-related proteins with clinical and immunological variables in treatment-naïve HIV-1-infected individuals. Differentially expressed IRPs between treatment-naïve individuals (TNs) and healthy controls (HCs) were determined. (A) Correlation among inflammation-related proteins (IRPs) is displayed using Spearman’s correlation matrix. Based on the correlation between the IRPs, these proteins were separated into seven clusters (1–7, from top to bottom). The clusters are highlighted in heatmap black boxes. (B) Heatmap showing Spearman correlations between differentially expressed proteins and clinical and immunological variables. Red and blue indicate positive and negative associations, respectively. *P < 0.05, **P < 0.01, ***P < 0.001.

Figure 5. Associations between inflammation-related proteins with clinical and immunological variables in patients on ART. Differentially expressed inflammation-related proteins (IRPs) between antiretroviral therapy (ART)-treated HIV-1-infected individuals and healthy controls (HCs) were determined. The heatmap shows the Spearman correlations between the differentially expressed proteins and clinical and immunological variables. Red and blue indicate positive and negative associations, respectively. *P < 0.05, **P < 0.01, ***P < 0.001.

Figure 6. Inflammation-related proteins for differentiating immunological responders and immunological non-responders in plasma. (A) Panel of six differentially expressed inflammation-related proteins (IRPs), including CDCP-1, CXCL11, CST5, SLAMF1, TRANCE, and CD5, was used to distinguish immunological non-responders (INRs) from immunological responders (IRs). (B) Expression levels of CDCP-1, CXCL11, CST5, SLAMF1, TRANCE, and CD5 in IRs and INRs. Data are expressed as the median (interquartile range, IQR). Statistical significance between two groups was determined by non-parametric, unpaired Mann–Whitney U test. AUC, area under the curve. *P < 0.05, **P < 0.01, ***P < 0.001, ****P < 0.0001.

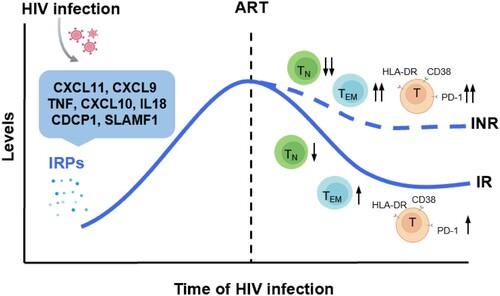
Figure 7. Significantly altered inflammation-related proteins and their relationship with immune recovery in HIV-1 infected individuals. HIV-1 infection leads to the upregulation of a cluster inflammation-related proteins (IRPs) (cluster 7), including CXCL11, CXCL9, TNF, CXCL10, IL18, CDCP1, and SLAMF1. These IRPs remained abnormal despite antiretroviral therapy (ART), particularly in immunological non-responders (INRs). Importantly, these IRPs in cluster 7 were closely associated with T cell differentiation, activation, and exhaustion.
Data availability statement
The datasets generated during and/or analyzed during the current study are available from the corresponding author on reasonable request.