
Figures & data
Figure 1. (A, B) Clinical presentations of case 1 and case 2. (C) Histopathological examination showing hyphal elements with Splendore-Hoeppli phenomenon. (D) Fungal culture showing a white and downy colony.
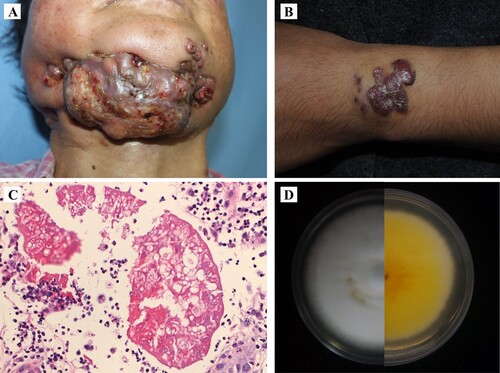
Table 1. Drug sensitivity tests showing the minimum inhibitory concentrations (MIC, in µg/mL) of the strains.
Figure 2. Colony diameters of BMU 11032-cap (A) BMU 08359-sub (B) and BMU08102-dis (C) in different culture temperatures at day 0, 2, 4, 6, 8, 10, 12 and 14. Comparison of growth diameters of the three M. canis strains at 28°C (D) and 37°C (E).
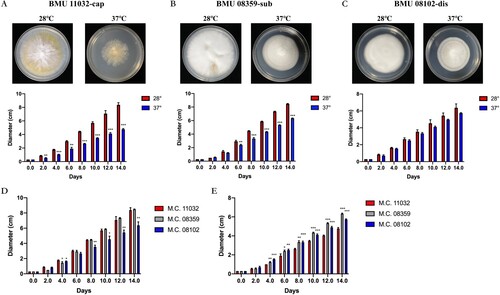
Table 2. Statistics of PacBio and Illumina sequencing.
Figure 3. The linear genome comparisons of the three M. canis strains showing location of sequence rearrangements.
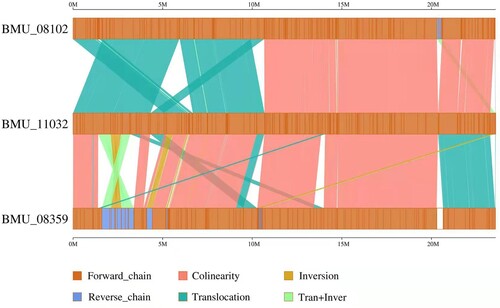
Table 3. Summary statistics of functional annotation of M. canis strains.
Figure 4. (A) Bubble plot showing the significantly enriched GO terms of upregulated genes for BMU08102-dis vs. BMU11032-cap. (B) The significantly enriched GO terms of upregulated genes for BMU08359-sub vs. BMU11032-cap.
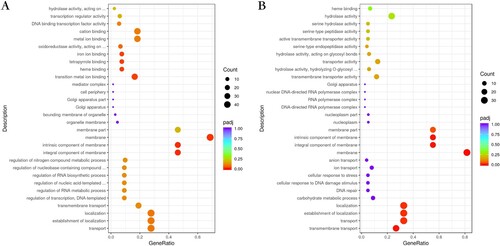
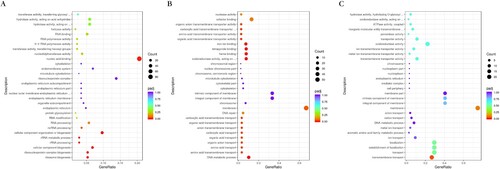
Figure 5. Bubble plot showing the significantly enriched KEGG terms of upregulated genes for BMU08102-dis (A), BMU08359-sub (B) and BMU11032-cap (C) 37°C vs. 28°C.
Data availability
All genomes and RNA-seq have been deposited in NCBI (accession number: PRJNA877796 and PRJNA877110).