
Figures & data
Figure 1. Characterization of liquid properties of EBOV IBs. (a) Representative fluorescence microscopy image of IBs (green) in an rgEBOV-VP30-GFP infected cell at 14 hours post infection. (b) Three-dimensional segmentation of the VP30-GFP signal of the same cell shown colour-coded according to sphericity. Scale bar = 5 µm. (c) Scatter plot of the sphericity of all segmented IBs (n = 344). (d) Fluorescence recovery of IBs. Cells were infected with rgEBOV-VP30-GFP at an MOI of 1, and at 16 hours post infection individual, whole IBs (marked with arrowheads) were photobleached and fluorescence recovery was monitored. (e) Quantification of fluorescence recovery of smaller (projected area < 5 µm2) and larger IBs (projected area > 5 µm2). p values of differences analysed by two-way ANOVA are shown. (f) Images of photobleached IBs 10 seconds before bleaching, immediately after bleaching (0 seconds), and 270 seconds after bleaching.
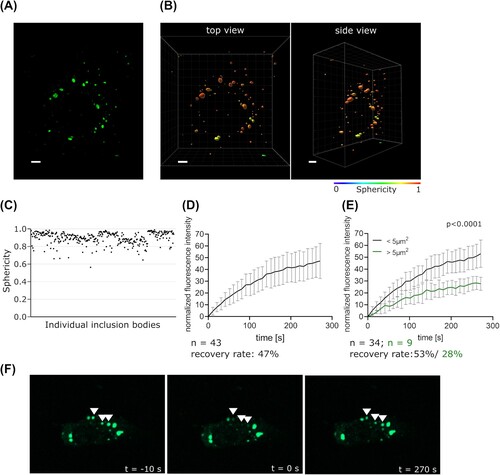
Figure 2. Characterization of the impact of IDRs on IB formation. (a) Schematic depiction of EBOV NP and NP mutants with amino acids in IDRs replaced by a flexible GS(G4S)12 linker. IDRs and known interaction sites with other viral proteins are shown. Amino acid conservation across ebolavirus species is indicated. NTD = N-terminal domain, CD = central domain, CTD = C-terminal domain (b) Hydrophobicity and charge at pH 7 of the region of EBOV NP containing the two large IDRs and of the GS(G4S)12 linker used to replace parts of this region. Hydrophobicity (according to Kyle/Doolittle) and charge was calculated as rolling average for a window size of 10 amino acids. (c) Expression of EBOV NP and NP mutants. Vinculin was used as a loading control. (d) Immunofluorescence imaging of NP or NP mutants. As a negative control the NP expression plasmid was omitted. Representative images out of two independent experiments with at least five images each per sample are shown. Scale bar = 30 µm. (e) Quantification of fluorescence recovery of IBs formed by NP or NP mutants. Cells were transfected with expression plasmids for NP or NP mutants, VP30-GFP, and either VP35 or empty vector, as indicated. p values of differences analysed by two-way ANOVA are shown.
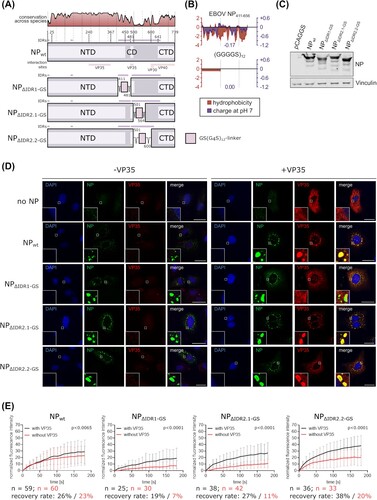
Figure 3. Role of RNA binding for IB formation. (a) Schematic depiction of EBOV NP and NP mutants with point mutations in amino acids necessary for RNA binding. IDRs and known interaction sites with other viral proteins are shown. (b) Expression of EBOV NP and an RNA binding-deficient NP mutant. Vinculin was used as a loading control. (c) Immunofluorescence imaging of wildtype NP or an RNA binding-deficient NP mutant expressed in cells in presence or absence of VP35. As a negative control the NP expression plasmid was omitted. Representative images out of two independent experiments with at least five images each per sample are shown. Scale bar = 30 µm. (d) Quantification of IBs per cell. IBs formed by expression of EBOV NP or an RNA binding-deficient NP in presence and absence of VP35 were counted. (e) Quantification of fluorescence recovery of IBs formed by wildtype NP or an RNA binding-deficient NP mutant. Cells were transfected with expression plasmids for VP35, VP30-GFP, and NP or the NP mutant as indicated. p values of differences analysed by two-way ANOVA are shown.
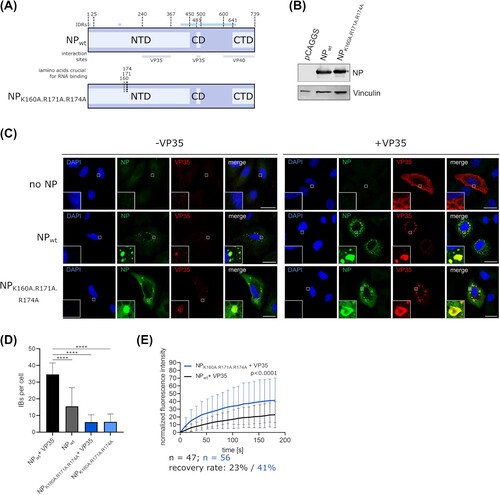
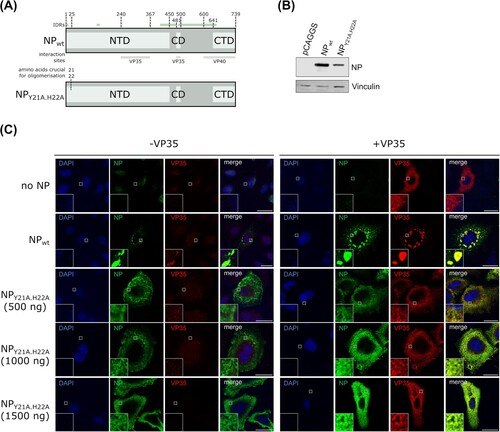
Figure 4. Role of oligomerization for IB formation. (a) Schematic depiction of EBOV NP and NP mutants with point mutations in amino acids necessary for oligomerization. IDRs and known interaction sites with other viral proteins are shown. (b) Expression of EBOV NP and an oligomerization-deficient NP mutant. Vinculin was used as a loading control. (c) Immunofluorescence imaging of NP or an oligomerization-deficient NP mutant (transfected amounts as indicated) expressed in cells in presence or absence of VP35. As a negative control the NP expression plasmid was omitted. Representative images out of three independent experiments with at least two images each per sample are shown. Scale bar = 30 µm.
Supplemental Material
Download PDF (325 KB)Supplemental Material
Download MS Power Point (25.9 MB)Data availability statement
All data supporting the findings of this study are available within the article and its supplementary material.