Figures & data
Figure 1. The study design and the characteristics of participants in our cohort. (A) The study design of our vaccine cohort. (B) Three convalescent COVID-19 patient cohorts, including WT strain infection only (cohort 1), BA.2 (cohort 2), and BA.5 (cohort 3) breakthrough infection following 3-dose of CoronaVac. (C) The demographic and clinical characteristics of four study cohorts.
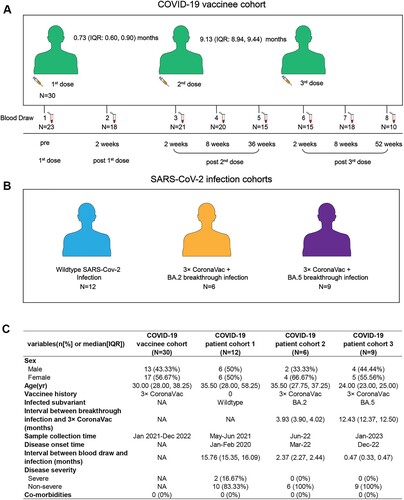
Figure 2. Dynamic SARS-CoV-2 specific Fc-mediated phagocytosis responses 2 weeks following each time of CoronaVac immunization. Antibody-dependent cellular phagocytosis (ADCP) (A, B) and antibody-dependent neutrophil phagocytosis (ADNP) (C, D) specific to Spike protein and RBD protein of WT strain, as well as five circulating Omicron variants, including BA.1, BA.2, BA.3, BA.4 and BA.5, at baseline before the first dose (0w), week 2 post the first dose (1 dose 2 wks), week 2 post the second dose (2 dose 2 wks) and week 2 post the third dose (3 dose 2 wks) were analyzed. Statistics were calculated using Kruskal-Wallis test with correction by controlling the false discovery rate for multiple comparisons between timepoints. * indicates p < 0.05, ** indicates p < 0.01, *** indicates p < 0.001, **** indicates p < 0.0001. ns indicates no significant difference.
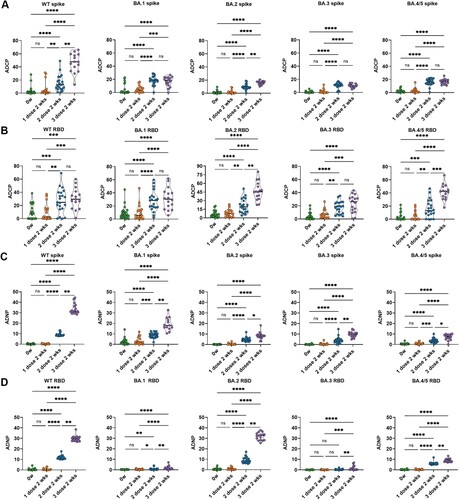
Figure 3. Longitudinal SARS-CoV-2 specific Fc mediated phagocytic responses induced by 2-dose and 3-dose of CoronaVac. The ADCP (A, B) and ADNP (C, D) specific to Spike protein and RBD protein of WT strain, as well as five circulating Omicron variants, including BA.1, BA.2, BA.3, BA.4 and BA.5, were analyzed at six time points, including at week 2 post the second dose (2 dose 2 wks), at week 8 post the second dose (2 dose 8 wks), at week 36 post the second dose (2 dose 36 wks), at week 2 post the third dose (3 dose 2 wks), at week 8 post the third dose (3 dose 8 wks) and at week 52 post the third dose (3 dose 52 wks). Statistics were calculated using Kruskal-Wallis test with correction by controlling the false discovery rate between time points. * indicates p < 0.05, ** indicates p < 0.01, *** indicates p < 0.001, **** indicates p < 0.0001. ns indicates no significant difference.
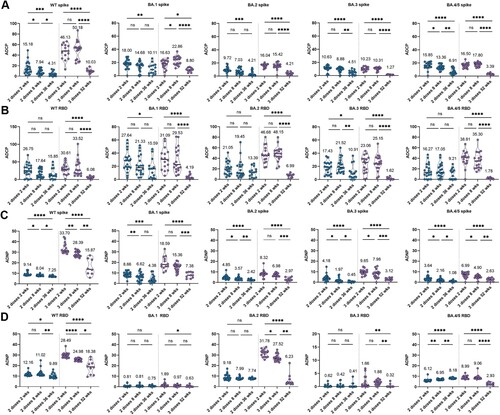
Figure 4. Fc mediated phagocytic responses induced by 2-dose of CoronaVac is lower than that in convalescent patients infected with WT SARS-CoV-2 without CoronaVac. The ADCP (A, B) and ADNP (C, D) specific to Spike protein and RBD protein of WT strain, as well as five circulating Omicron variants, including BA.1, BA.2, BA.3, BA.4 and BA.5, were compared between vaccinees at 36 weeks after 2 doses and convalescent patients infected with WT SARS-CoV-2 without CoronaVac at 15.76 (IQR: 15.35, 16.09) months after infection. When the data is normally distributed, unpaired t test is used. When the data is non-normal distribution, Mann-whitney U test is used for comparison between the two cohorts. * indicates p < 0.05, ** indicates p < 0.01, *** indicates p < 0.001, **** indicates p < 0.0001. ns indicates no significant difference.
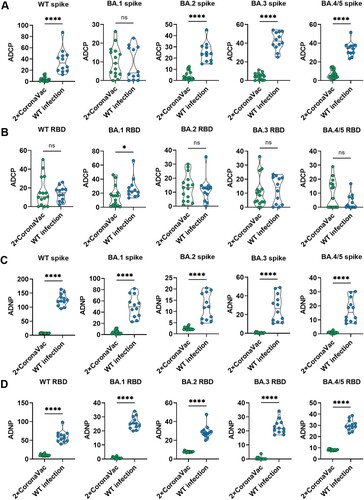
Figure 5. Fc effector Fc mediated phagocytic induced by 3-dose of CoronaVac is lower than that in BA.2 breakthrough infection among 3-dose of CoronaVac recipients. The ADCP (A, B) and ADNP (C, D) specific to Spike protein and RBD protein of WT strain, as well as five circulating Omicron variants, including BA.1, BA.2, BA.3, BA.4 and BA.5, were compared between vaccinees at week 8 after 3-dose of CoronaVac and convalescent patients with BA.2 breakthrough infection after receiving 3 doses of CoronaVac. When the data is normally distributed, unpaired t test is used. When the data is non-normal distribution, Mann-whitney U test is used for comparison between the two cohorts. * indicates p < 0.05, ** indicates p < 0.01, *** indicates p < 0.001, **** indicates p < 0.0001. ns indicates no significant difference.
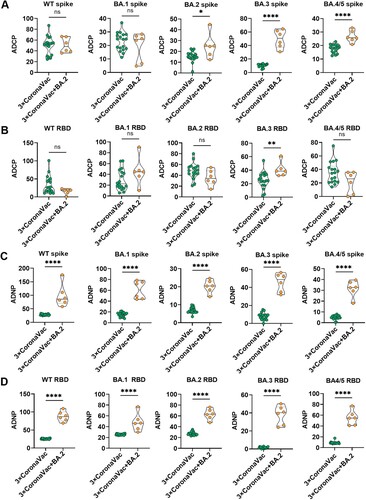
Figure 6. Cross-reactivity of antibody Fc-mediated phagocytic functions among vaccinees and COVID-19 convalescent individuals. The ADCP (A) and ADNP (B) responses specific to WT strain and Omicron subvariants in different cohorts, including vaccinees with 3 doses of CoronaVac, convalescent patients infected with WT strain without CoronaVac, BA.2 and BA.5 breakthrough infection after receiving 3 doses of CoronaVac. The average fold decrease was shown at the top of each bar. When the data is normally distributed, paired t test is used to compare the Fc effector functions between ancestral strain and Omicron subvariants. When the data is non-normal distribution, Wilcoxon matched-pair signed rank test is used. (C) Fold changes of ADCP and ADNP responses specific to Omicron subvariants Spike relative to that specific to WT strain. The dotted line represents no fold difference, while lines indicate the median. Statistical differences in fold changes between different cohorts were calculated using the Kruskal-Wallis test with correction by controlling the False Discovery Rate. * indicates p < 0.05, ** indicates p < 0.01, *** indicates p < 0.001, **** indicates p < 0.0001. ns indicates no significant difference.
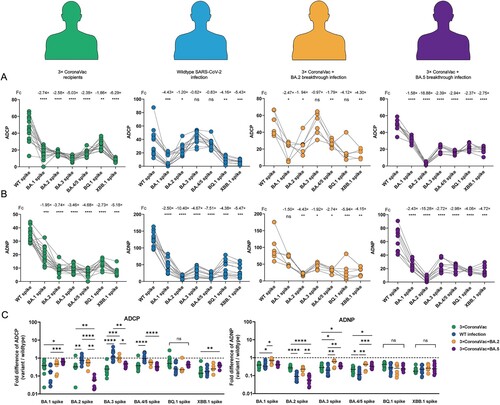
Figure 7. Correlation analysis of ADCP, ADNP, IgG titer, and neutralization activity elicited by CoronaVac. Statistics were analyzed using Spearman correlation analysis. p < 0.05 was considered to be statistically significant.
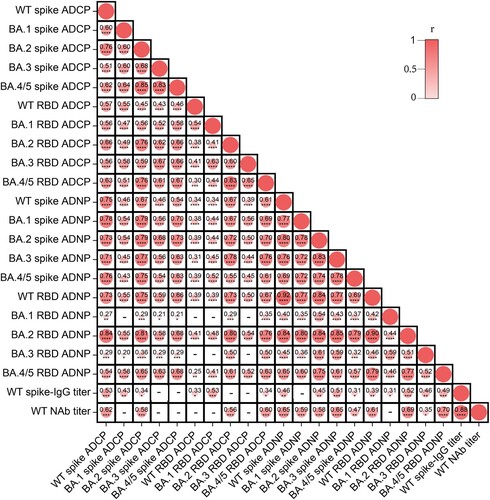
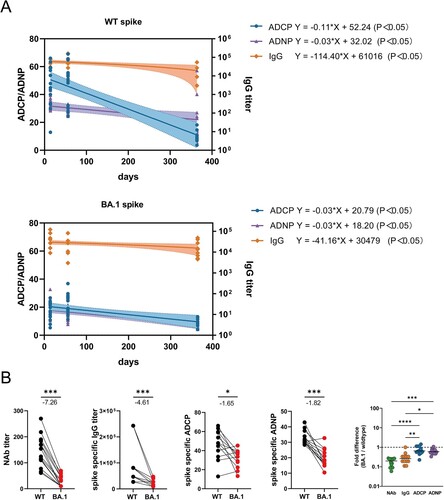
Figure 8. ADCP and ADNP responses were more durable and cross-reactive than IgG and NAb responses induced by CoronaVac. (A)The waning rate of ADCP, ADNP and IgG titer specific to WT strain and BA.1 Spike after 3 doses of CoronaVac. (B) The fold changes of NAbs, IgG titer, ADCP, and ADNP specific to BA.1 over WT Spike at week 2 following 3rd dose of CoronaVac. Statistical differences of fold changes among NAbs, IgG titer, ADCP, and ADNP specific to BA.1 over WT Spike were calculated using the Kruskal-Wallis test with correction by controlling the false discovery rate. * indicates p < 0.05, ** indicates p < 0.01, *** indicates p < 0.001, **** indicates p < 0.0001. ns indicates no significant difference.