Figures & data
Table 1. Comparison between VOC-specific RT-qPCR assays and next generation sequencing for identification of VOC in wastewater.
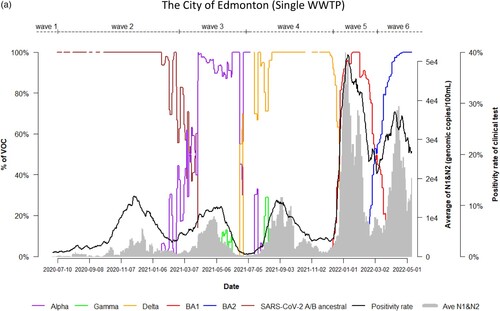
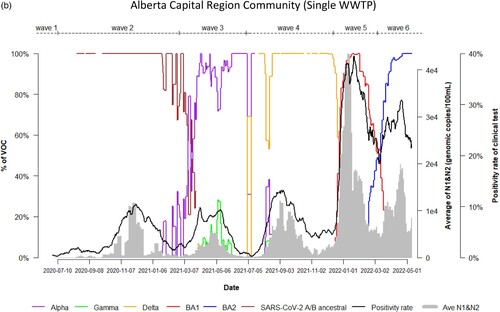
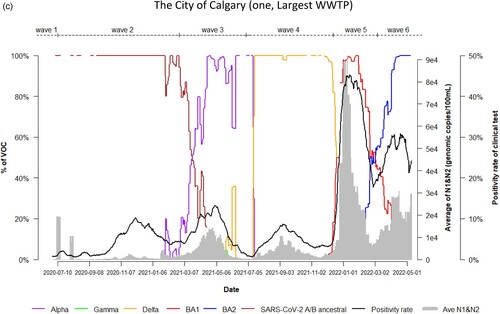
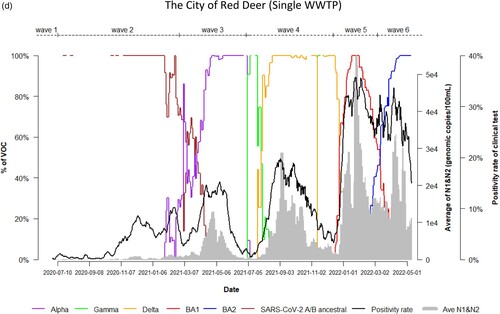
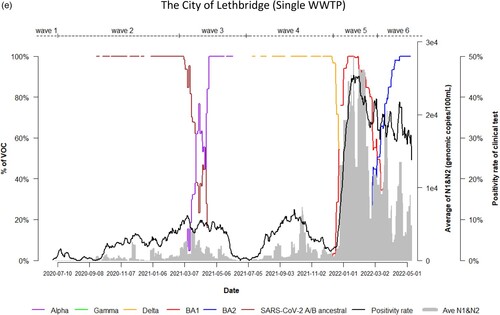
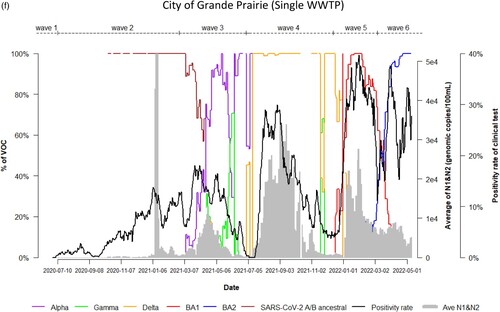
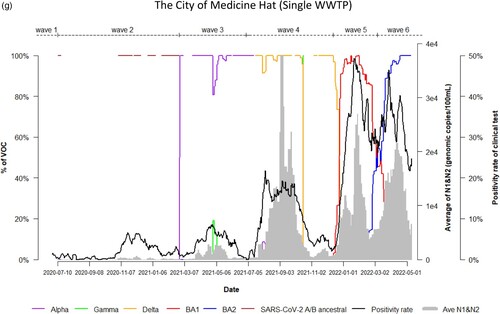
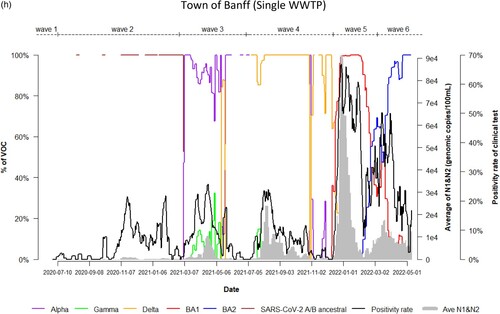
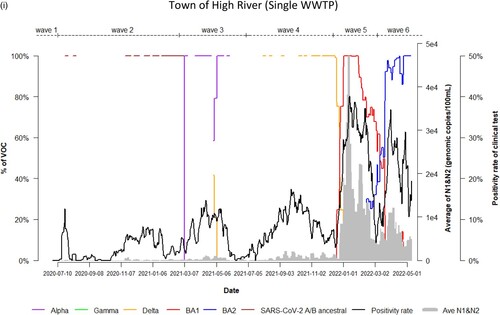
Figure 1. Time trend of relative abundance of A/B ancestral, Alpha, Gamma, Delta, Omicron BA.1 and BA.2 and the levels of SARS-CoV-2 RNA (average of N1 and N2 gene) detected in wastewater, and COVID-19 test positivity rates. A percentage of relative abundance of A/B ancestral (dark-red line), Alpha (purple line), Gamma (green line), Delta (orange line), Omicron BA.1 (red line) and Omicron BA.2 (blue line) in wastewater estimated by VOC specific RT-qPCR (based on population weighted 7-day rolling data); the positivity rate (%) in clinical tests (black line) (population weighted 7-day rolling average); and population-weighted 7-day rolling average of SARS-CoV-2 N1/N2 levels (genomic copies/100 mL) in wastewater (grey area) of nine WWTPs in Alberta during Waves 1–6 of COVID-19 (indicated on top of the Figure by segmental dash line).
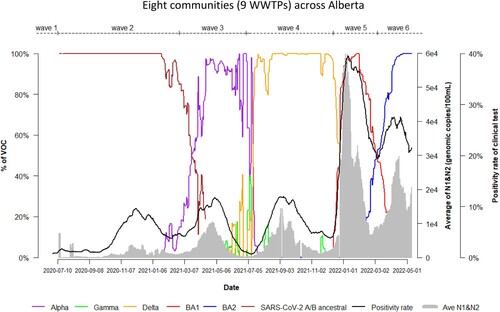
Table 2. Total wastewater samples tested by VOC-specific RT-qPCR, VOC positivity and levels in correspondence with Waves 3–6, and the dates of first identification of SARS-CoV-2 VOC in wastewater and clinical COVID-19 case with the VOC.
Table 3. Days required for SARS-CoV-2 VOC to reach the defined levels of relative abundances (%) in wastewater after its first detection.
Table 4. Correlation of the relative abundance of predominant VOC in wastewater with COVID-19 testing positivity rate of population in sewersheds served by nine WWTPs in total using Spearman’s correlation analysis.